
Placemaking is a continuing process and ongoing approach by councils and local stakeholders to help create, shape, manage and promote public spaces such as high streets, parks, heritage, leisure, for the benefit of local and national communities, focusing on health, wellbeing, happiness, and identity.
Glossary
Below are definitions of terms that are commonly used by those involved in place management.
- Placemaking
- Place Leadership
- Place Capacity for Transformation
- The 25 priorities
- Viability
- Vitality
- 237 Viable and Vitality Factors
- Covid 19 Exposure Index
- Active Hierarchy
- Retail Hierarchy
- Town Centre Designation
- Simplified Place Hierarchy
- Annual Footfall Signature
- Weekly Footfall Signature
- Daily Footfall Signature
- Estimated Footfall Data
- Calibrated Footfall Data
- Indices of Multiple Deprivation
Placemaking
Definition
Definition
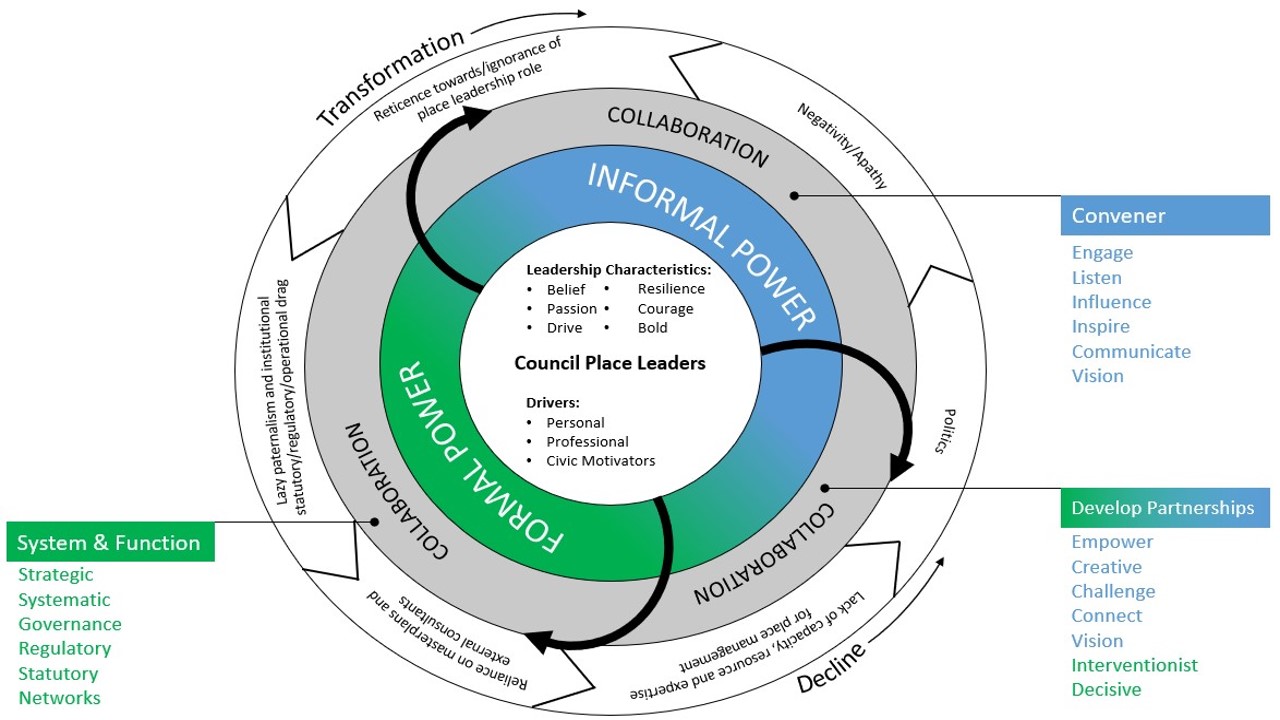
Place leadership is an inspirational force that brings about change in a location in a collaborative fashion. It is a critical success factor for vital and viable high streets. Place leaders have strong belief in their purpose, they are driven, passionate, courageous, bold and resilient. They are professional, highly skilled and knowledgeable. They have a civic responsibility and have a profound awareness of the value of collaborative working across different people, organisations and sectors. Place leadership is highly motivational as it develops direction, capacity and enthusiasm for change.
Methodology
IPM have constructed a cycle diagram for place leaders to use to help them to reflect on their own traits, behaviours and the blockers and enablers they face. It also provides an indication of where they draw their authority from and how they utilise their power.
Related Products
Developing Place Leaders Programme
Reference
Place Leadership in English Local Authorities - a critical success factor for vital and viable high streets | Resources | High Street Task Force (highstreetstaskforce.org.uk)
Place capacity for transformation
Definition
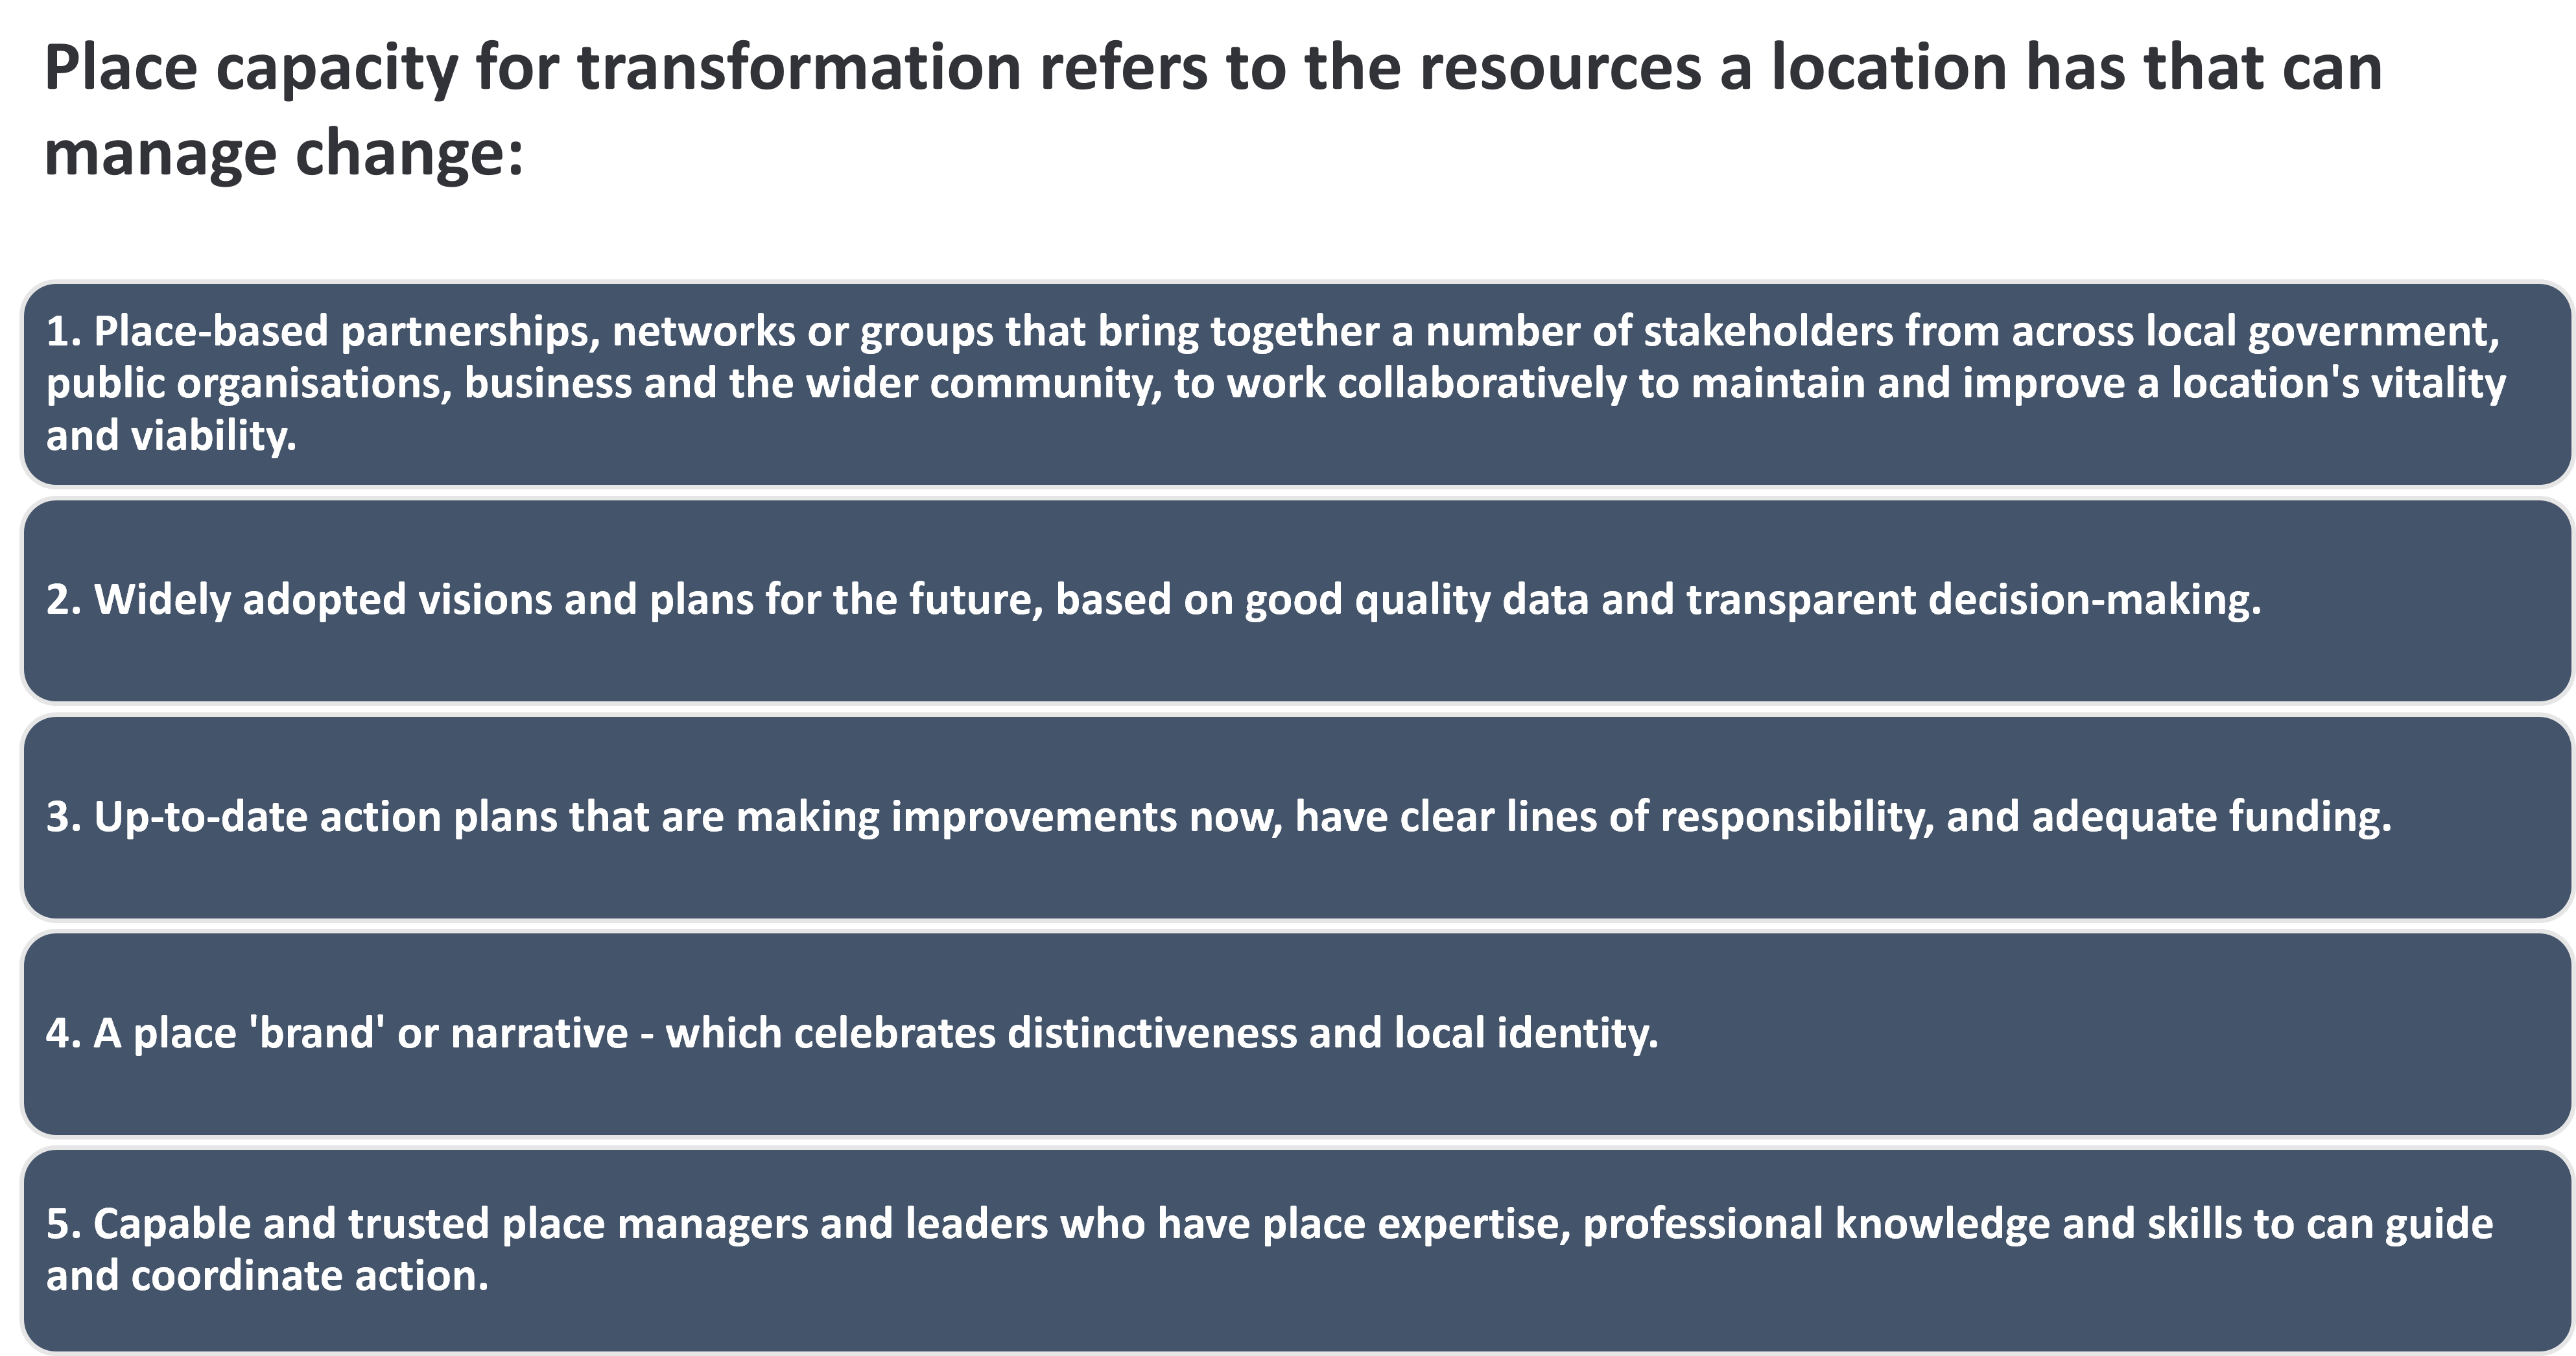
Place capacity for transformation refers to the resources a location has that can manage change. There are 5 dimensions to place capacity for transformation
1. Place-based partnerships, networks or groups that bring together a number of stakeholders from across local government, public organisations, business and the wider community, to work collaboratively to maintain and improve a location's vitality and viability.
2. Widely adopted visions and plans for the future, based on good quality data and transparent decision-making.
3. Up-to-date action plans that are making improvements now, have clear lines of responsibility, and adequate funding.
4. A place 'brand' or narrative - which celebrates distinctiveness and local identity.
5. Capable and trusted place managers and leaders who have place expertise, professional knowledge and skills to can guide and coordinate action.
Methodology
The following elements of place capacity are on the HSTF Capacity Map:
1. Business Improvement Districts, with contact details, provided by The BID Foundation and the Institute of Place Management
2. High Streets Fund, Towns Fund and Heritage Action Zone, provided by DLUCH
3. Civic societies, with contact details, provided by Civic Voice
The following elements of place capacity are on the IPM Capacity Map:
1. Business Improvement Districts that meet, or are working towards, Industry Standards, with contact details.
2. Place management organisations or partnerships, with contact details, that are Partners of the Institute.
3. The number of professional place managers/leaders in the location.
Related Products
The High Street Task Force Place Capacity map which is used by the Developing Place Leaders Programme and the Unlocking Your place Potential Programme
Reference
Future Place: Unlocking the potential of places | Resources | High Street Task Force (highstreetstaskforce.org.uk)
The 25 Priorities
Definition
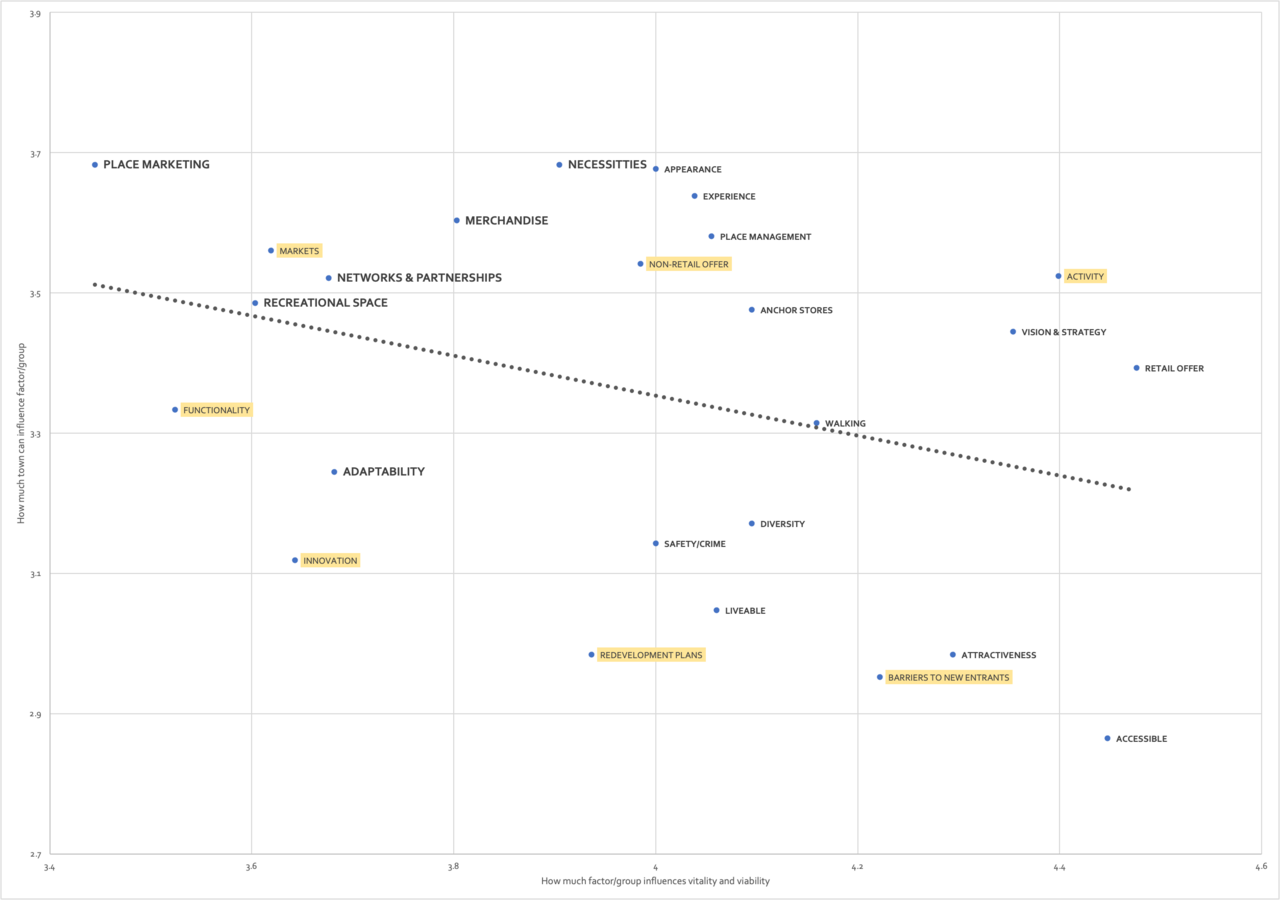
The 25 priorities vitality and viability are a set of combined indicators that local place leader’s and managers should be focusing on, in their quest for successful and sustainable high streets that meet the needs of their catchment communities.
Methodology
The 25 priorities for vitality and viability are formed from an original set of 237 factors which were found to influence high street success. Each priority was formed by combining factors that were the most influential and also were controllable locally. In other words, each of the priorities will make a difference to the vitality and viability of the town, but local place leaders and stakeholders can also do something about the priority.
Each priority was formed by combining related/synonymous factors that were identified semantically and visually. Each priority was tested statistically to confirm the combinatory variable (scale) could be formed. In other words, that the composite factors in the priority were similar. The formula for calculating the score for a priority (influence x control) is the mean of the influence x control factors included in it.
Related Products
Unlocking Your Place Potential Programme
Reference
Parker C, Ntounis N, Millington S, et al. (2017) Improving the vitality and viability of the UK High Street by 2020: Identifying priorities and a framework for action. Journal of Place Management and Development 10(4). Emerald: 310–348. DOI: 10.1108/JPMD-03-2017-0032.
Ntounis N and Parker C (2017) Engaged scholarship on the High Street: the case of HSUK2020. Journal of Place Management and Development 10(4). Emerald: 349–363. DOI: 10.1108/JPMD-02-2017-0024.
Viability
Definition
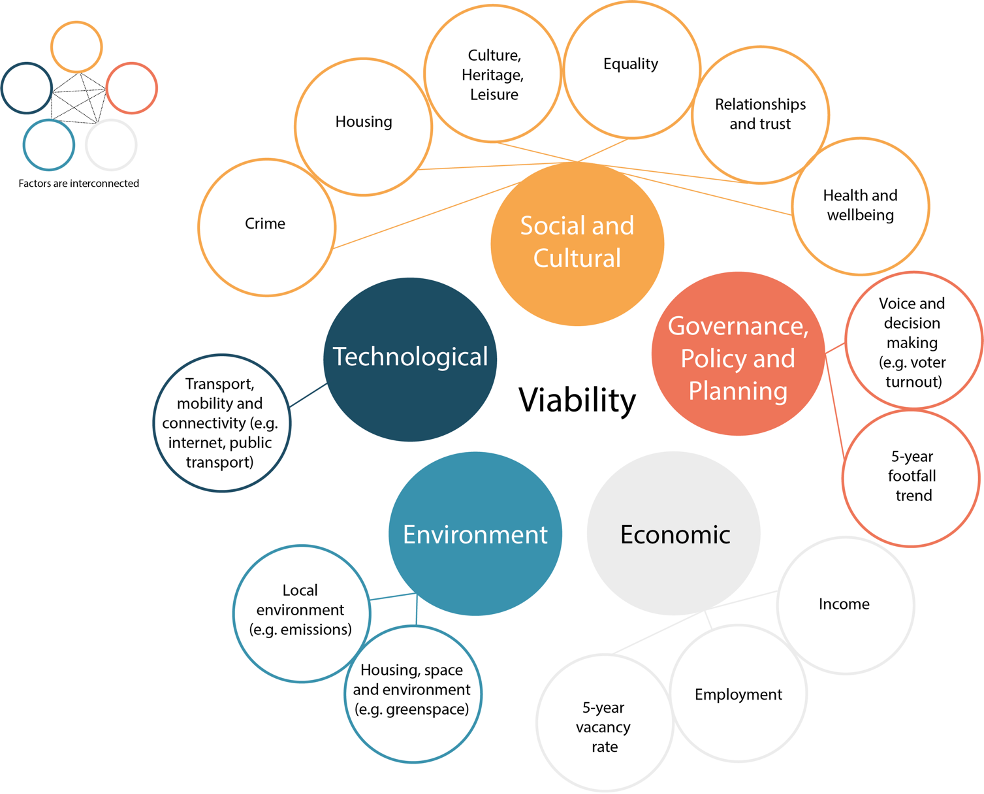
Viability refers to a town centre's and a high street's ability to meet the changing needs of a local community. These needs can be broken down into four themes. Firstly, sustainability, where future needs are covered, such as having a healthy, green, active, commercially successful high street. Secondly, resilience, being able to persist and absorb social, environmental and economic challenges. Thirdly, adaptability, where building use and local government regulation allow change and flexibility according to local needs. Finally, it refers to the liveability of these places, the wellbeing of residents and the quality of life.
Methodology
In order to operationalise this new conceptualization of viability, there is a need to find ways in which it can be measured, so that policy makers and practitioners can gain insight into how successfully their high street is performing in relation to these five categories of viability, and so that interventions and strategies that are put in place can be evaluated.
In doing so, we have looked at data that require the following three conditions:
- That are easily accessible – either publicly available for place managers and leaders to use or are readily measured at a local level
- That data is pertinent to conceptualisation of viability
- That data comes down to a fine geographical granularity, such as Lower Super Output Areas (LSOA) so that data becomes relevant to the scale of the high street
Through a critical review of available indices and datasets we selected the following two:
Indices of Multiple Deprivation 2019 scores for the seven domains of deprivation:
- Income Deprivation
- Employment Deprivation
- Education, Skills and Training Deprivation
- Health Deprivation and Disability
- Crime
- Barriers to Housing and Services
- Living Environment Deprivation
This can be accessed here: CDRC maps
Community Wellbeing Index (Co-op). Measuring:
- Health
- Relationships & Trust
- Culture, Heritage & Leisure
- Education & Learning
- Equality
- Housing, Space & Environment
- Economy, work & Employment
- Voice & Participation
- Transport, Mobility & Connectivity
This can be accessed here: Community Wellbeing Index (Co-op)
Local data:
- 5-year footfall trend
- 5-year vacancy rate
Viability can be measured and operationalised using the following interactive tool: Viability tool.xlsx
Related Products
Reference
Ntounis, N, Sønderland Saga, R, Loroño-Leturiondo, M, Warnaby, G & Parker, C (2021) Re-conceptualising High Street viability: A critical introduction in the UK context, The International Review of Retail, Distribution and Consumer Research
Vitality
Definition
Vitality is reflected in how busy a centre is at different times and in different parts (i.e. how lively a centre feels)
Methodology
There is no set method for assessing town centre vitality, however there are consistent indicators of town centre vitality (Guimarães, 2017) that can be measured, such as:
- Commercial yields on non-domestic property
- Footfall/Pedestrian Flows
- Diversity of Use
- Proportion of vacant street-level property in the primary retail area
As part of the Vital and Viable IPM programme, such indicators are examined in terms of performance and an assessment of vitality, using the High Street UK 2020 research as a framework for analysis, is given.
Related Products
The Vitality and Viability Programme
Reference
Guimarães, P. P. C. 2017. “An evaluation of urban regeneration: the effectiveness of a retail-led project in Lisbon.” Urban Research and Practice 10 (3): 350 - 366. doi:10.1080/17535069.2016.122437.
Parker, C., N. Ntounis, S. Millington, S. Quin and F. R. Castillo-Villar. 2017. “Improving the vitality and viability of the UK high street by 2020”. Journal of Place Management and Development 10 (4): 310 - 348. doi:10.1108/JPMD-03-2017-0032.
237 Vitality and Viability Factors
Definition
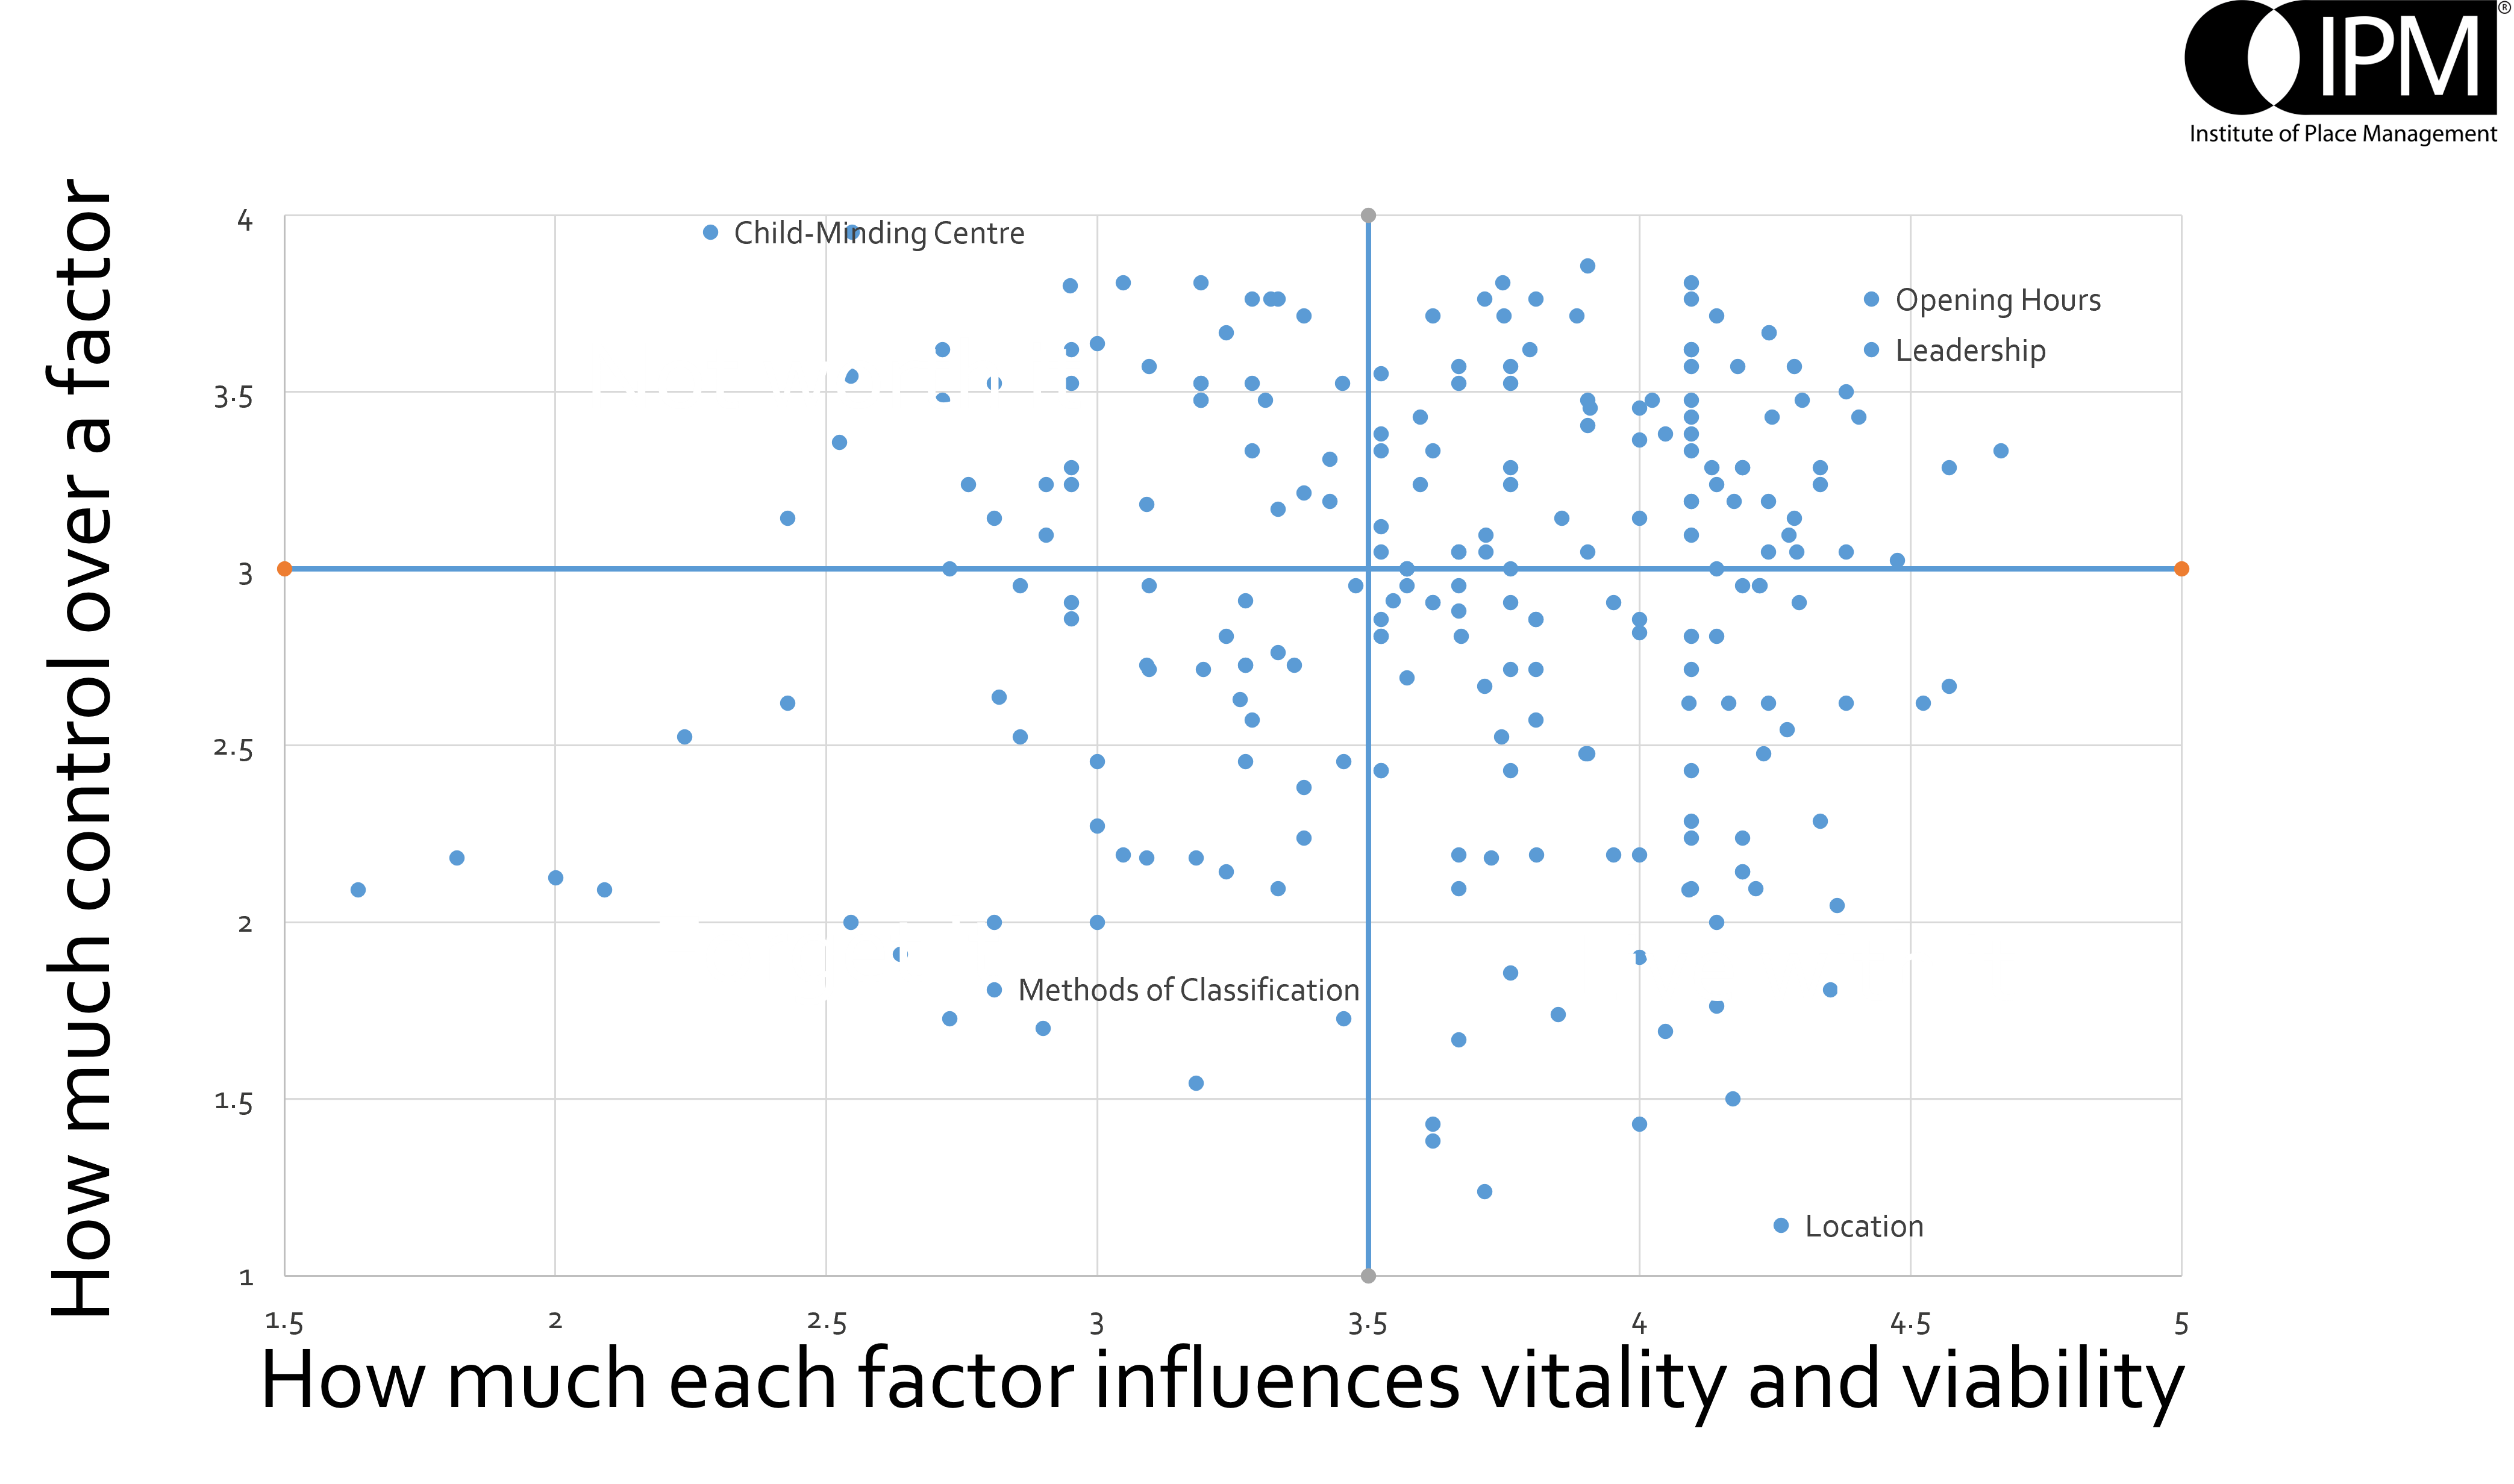
The 237 Vitality and Viability Factors is the extended framework of factors influencing the vitality and viability of High Streets. They are all related to the top 25 priorities, but provides a more exhaustive list of factors and can be ranked based on three criteria:
1. How much of a priority it should be for the High Street
2. How much it will influence the vitality and viability of the High Street
3. How much control place managers/local stakeholders have over it
Methodology
Factors were identified through a systematic literature review and more were identified when the framework was reviewed by partner towns during a full day workshop.
Framework can be used for place managers (and broader stakeholders to evaluate how suitable the factors are for their location and how they would contribute to the vitality and viability of a given High Street by looking at the influence and control, and how they interlink with other factors.
Related Products
Evidence on a Page found in the High Street Task Force Resource Library, an example can be found here: Consumer Choice
Reference
Parker, C., Ntounis, N., Millington, S., Quin, S. and Castillo-Villar, F. R. (2017), "Improving the vitality and viability of the UK High Street by 2020: Identifying priorities and a framework for action", Journal of Place Management and Development, Vol. 10 No. 4, pp. 310-348. https://doi.org/10.1108/JPMD-03-2017-0032
COVID-19 Exposure Index
Definition
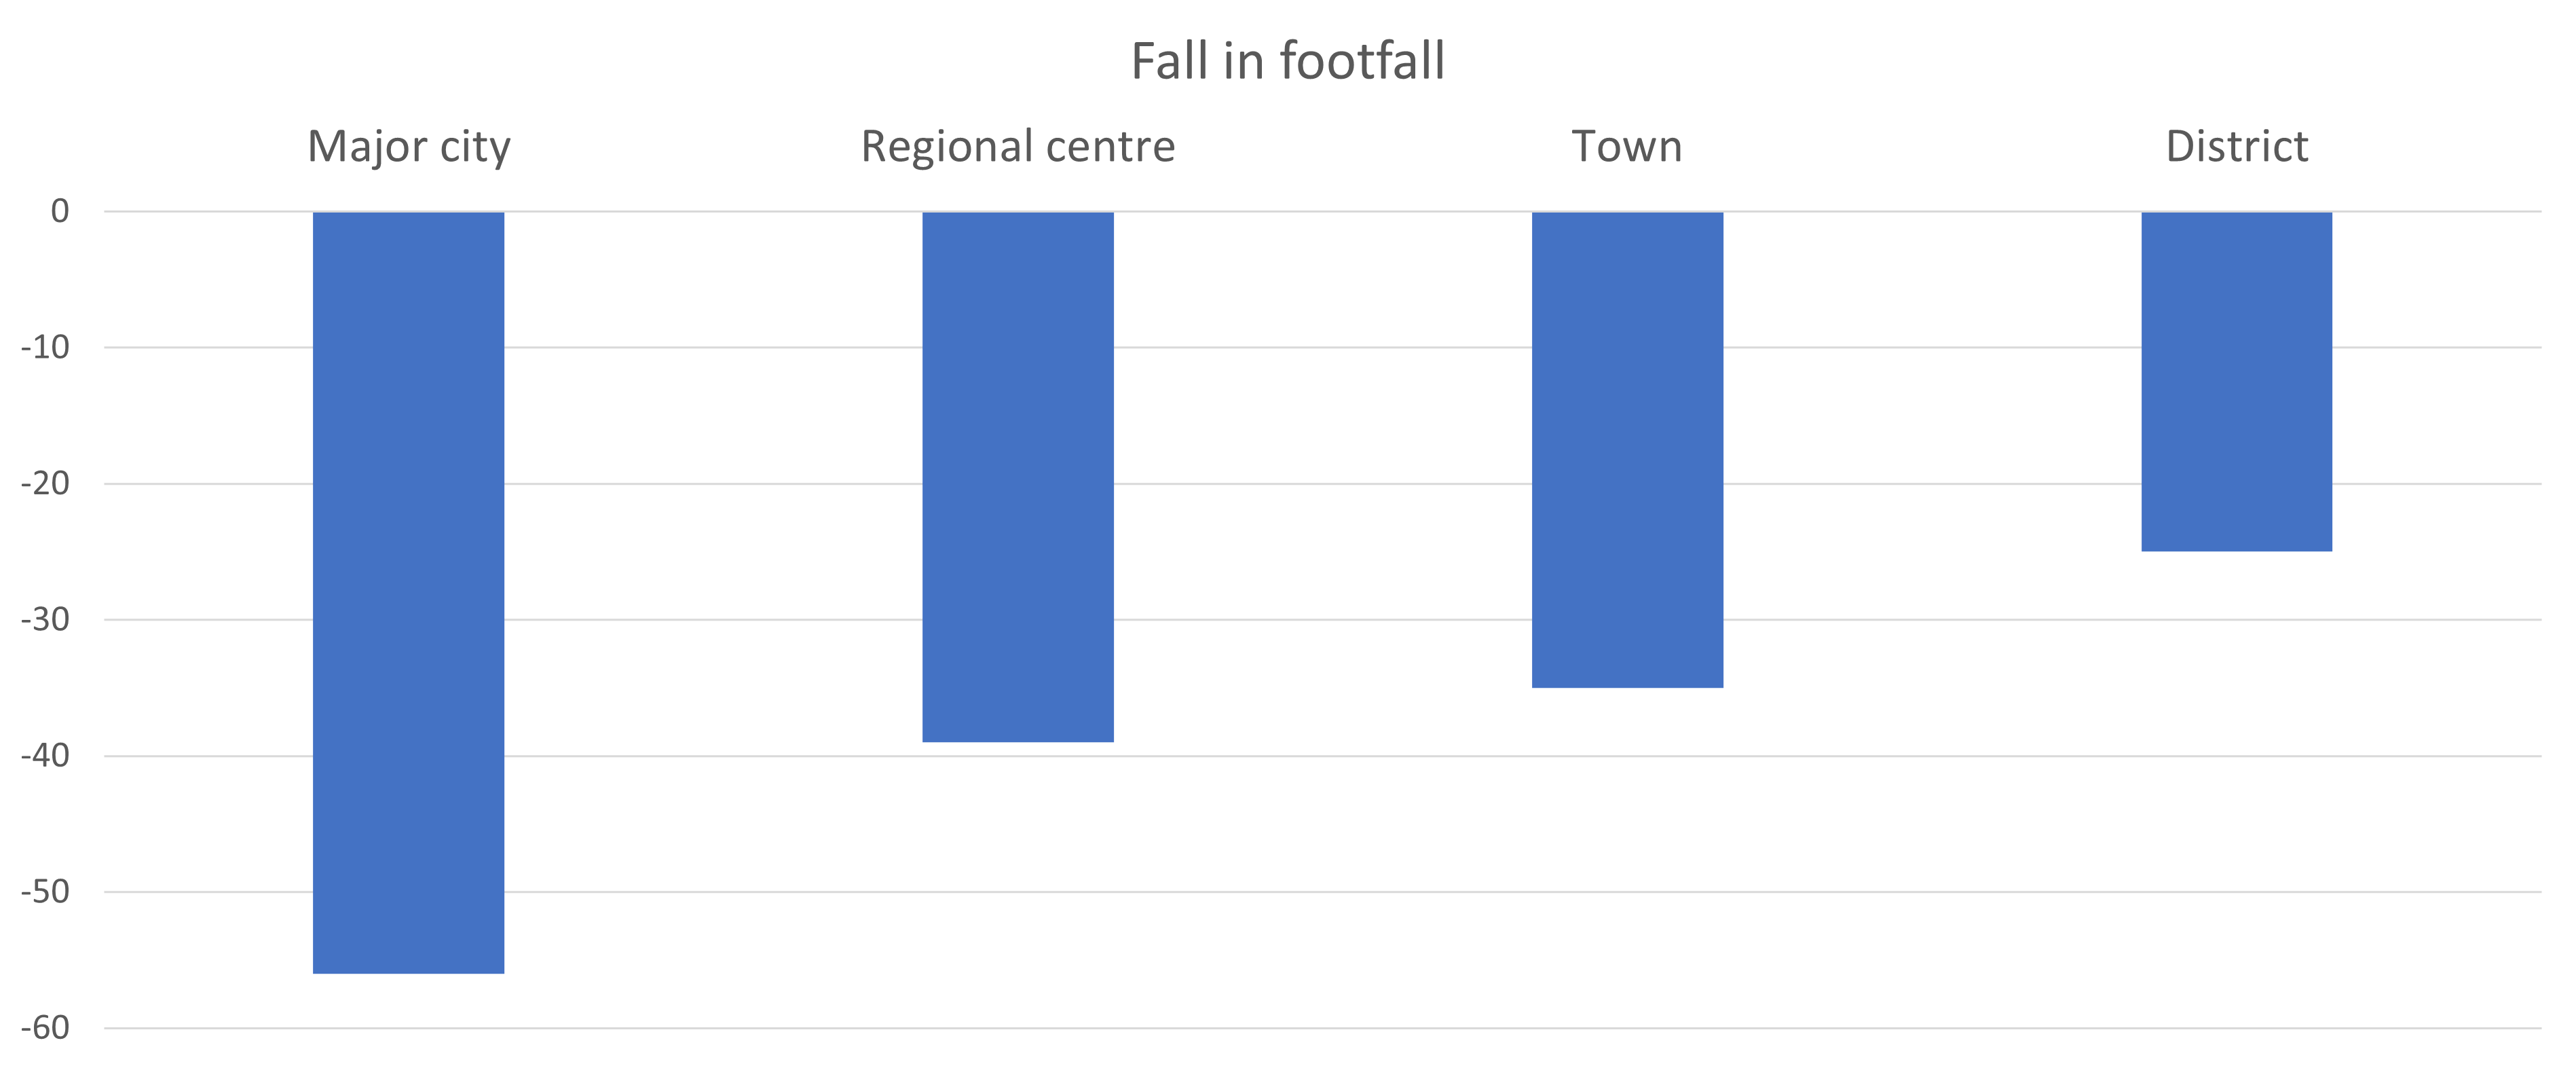
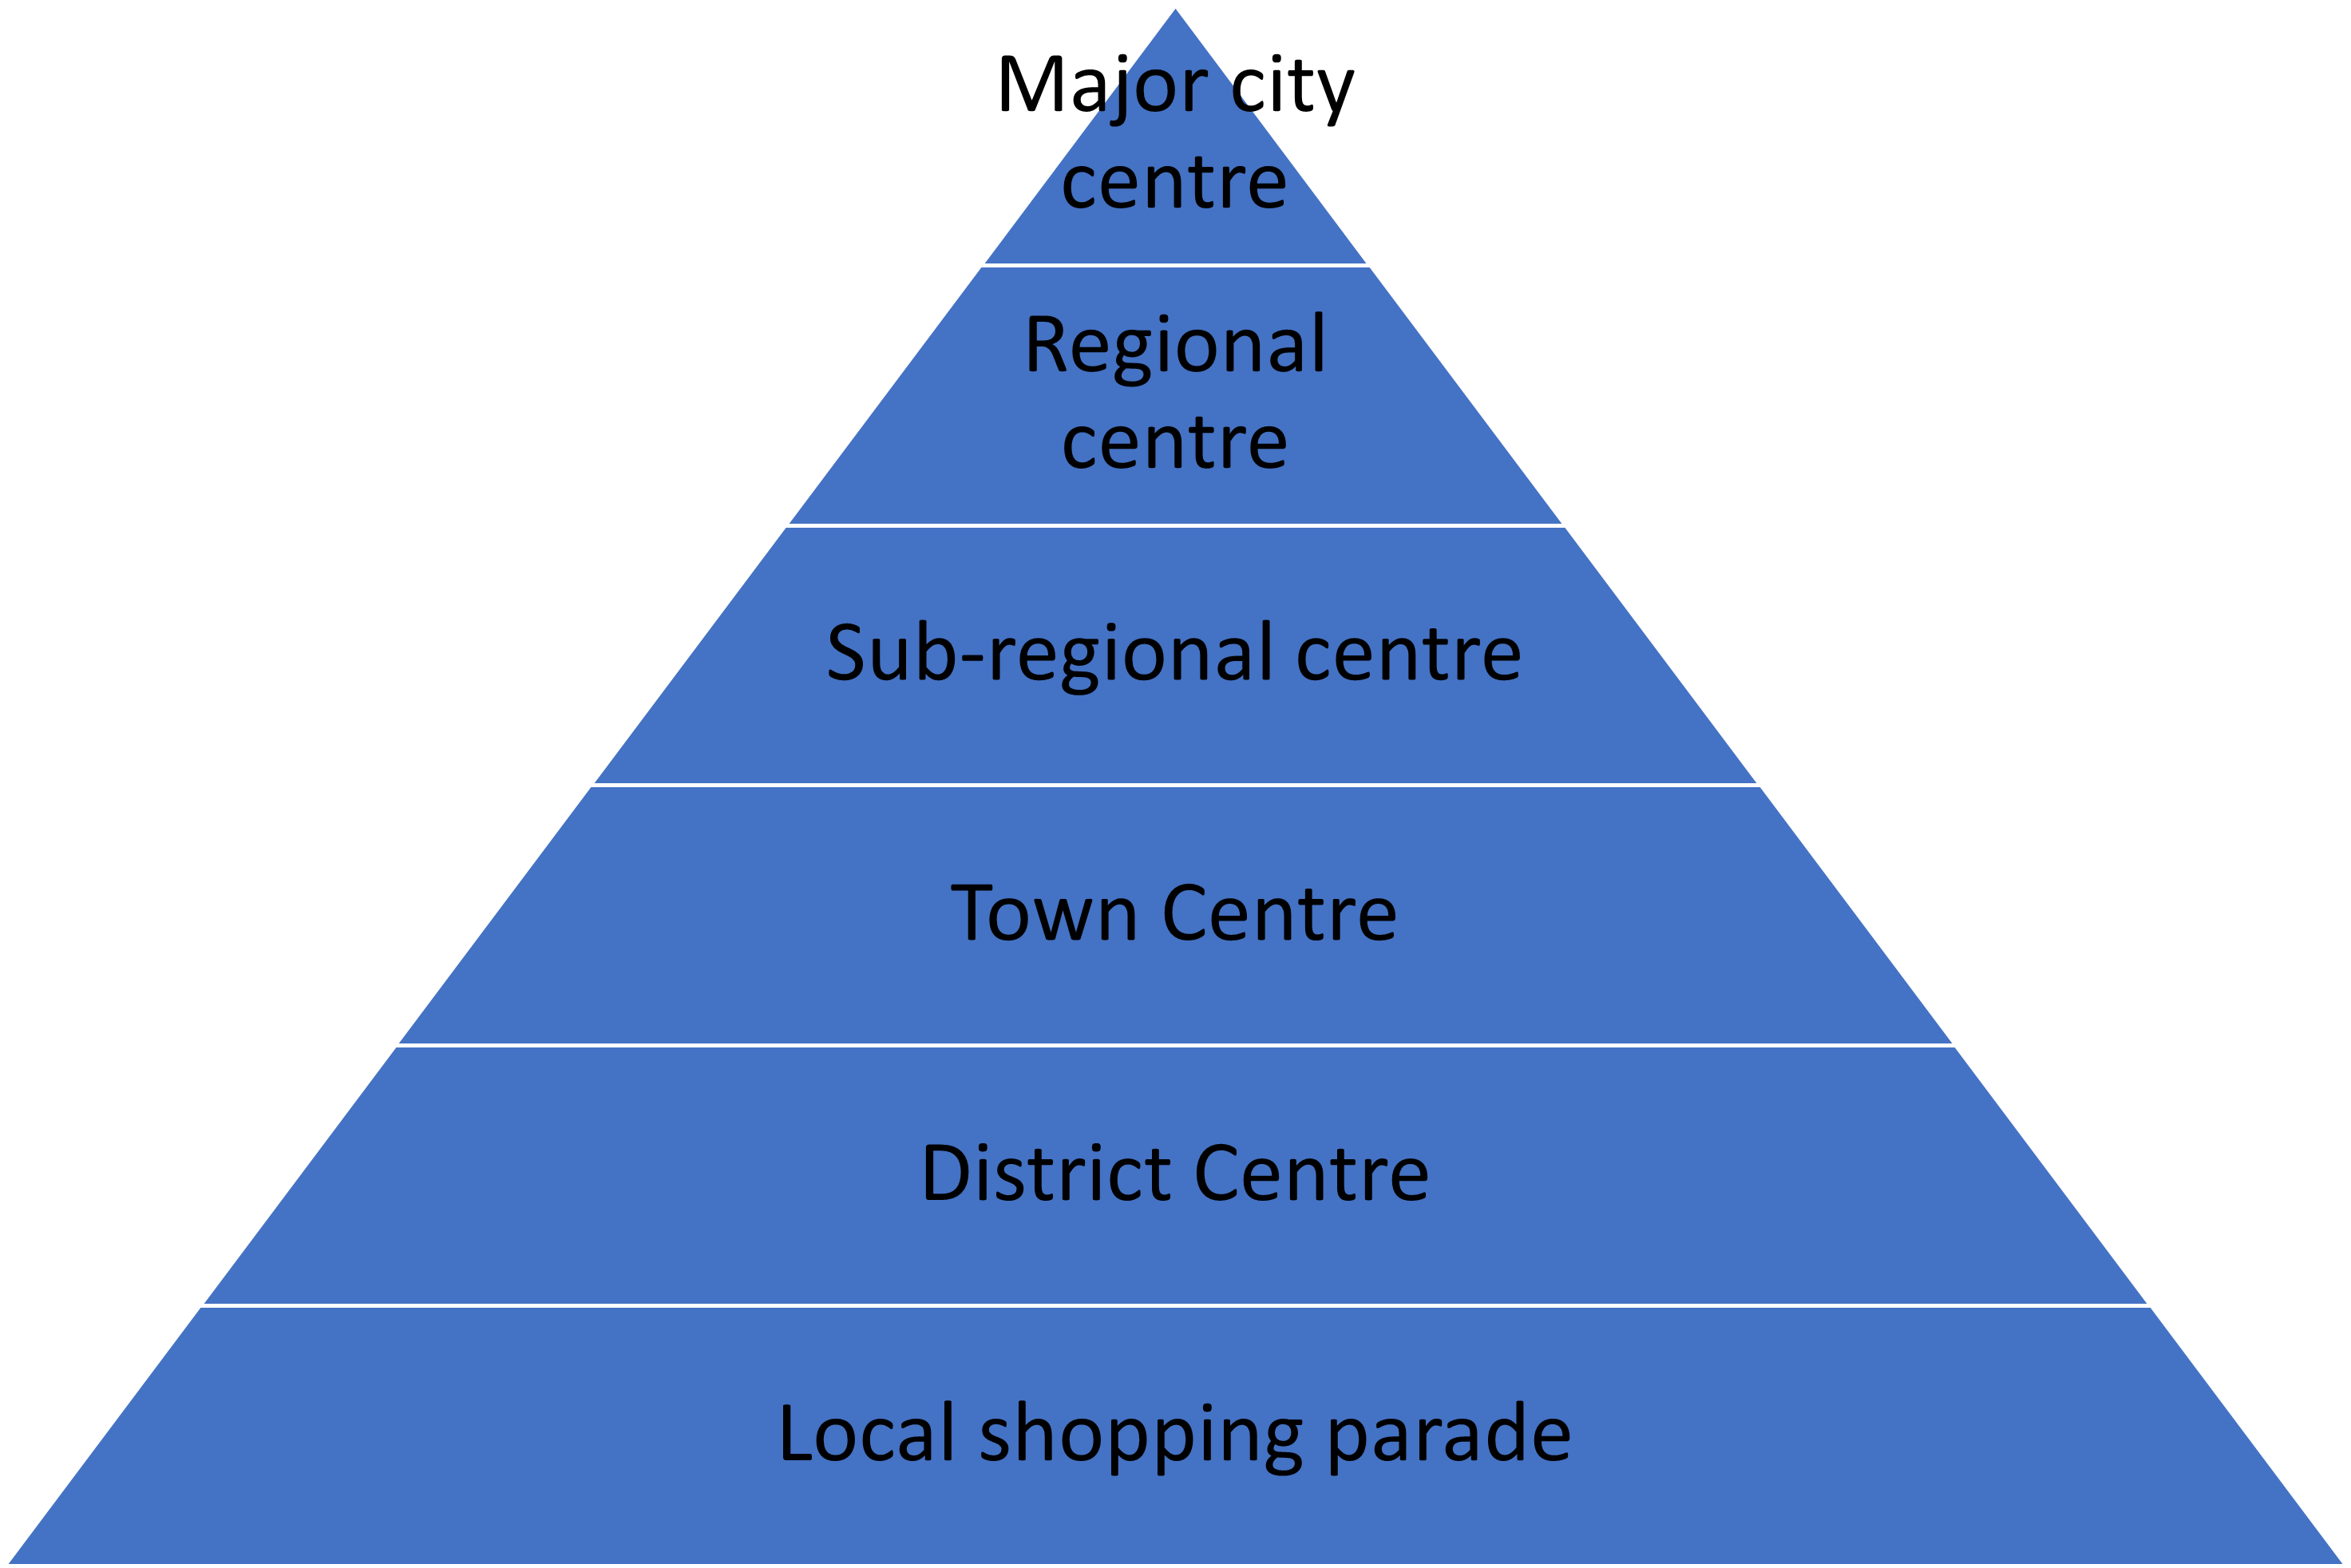
In order to help places that do not have footfall data understand the impact of COVID-19, the COVID-19 Exposure Index estimates the reduction in footfall volume during Jun-Sep 2020 compared to the same period in 2019 in a particular location. The COVID-19 Exposure Index uses a simple retail hierarchy (Major City; Regional Centre; Sub Regional Centre; Major Town; Town and District) based on the number of retail units from the CDRC data set. Retail units refer to any establishment in the centre, regardless of its function, and included in every Use Class (Class A, B, C, D, E, F and Sui Generis). Therefore, retail units can be restaurants, shops, museums, banks, churches, libraries, leisure centres, gyms, health centres etc.
Methodology
In order to identify the correct size category for the town, find the number of retail units from the Consumer Data Research Centre website (CDRC’s retail typography map). This is contained in the Area Information box when hovering over the highlighted town centre area. The classification and footfall drop is explained as such:
Town classification:
Major City +1000 units
Regional Centre 401-1000
Town 100-400
District less than 100
Footfall drop:
Major City: -56%
Regional Centre: -39%
Town: -35%
District: -25%
Related Products
Desk Research and Reports for the Unlocking your Place Potential Programme
The Transforming Your High Street Report
Reference
COVID-19 Exposure was used in the HSTF Transforming Your High Street (TYHS) Reports. These were sent to Local Authorities that had applied to the Future High Street Fund to provide them with advice on how they might need to change the vision and plans for their high street, in light of the pandemic and other factors.
Activity Hierarchy
Definition
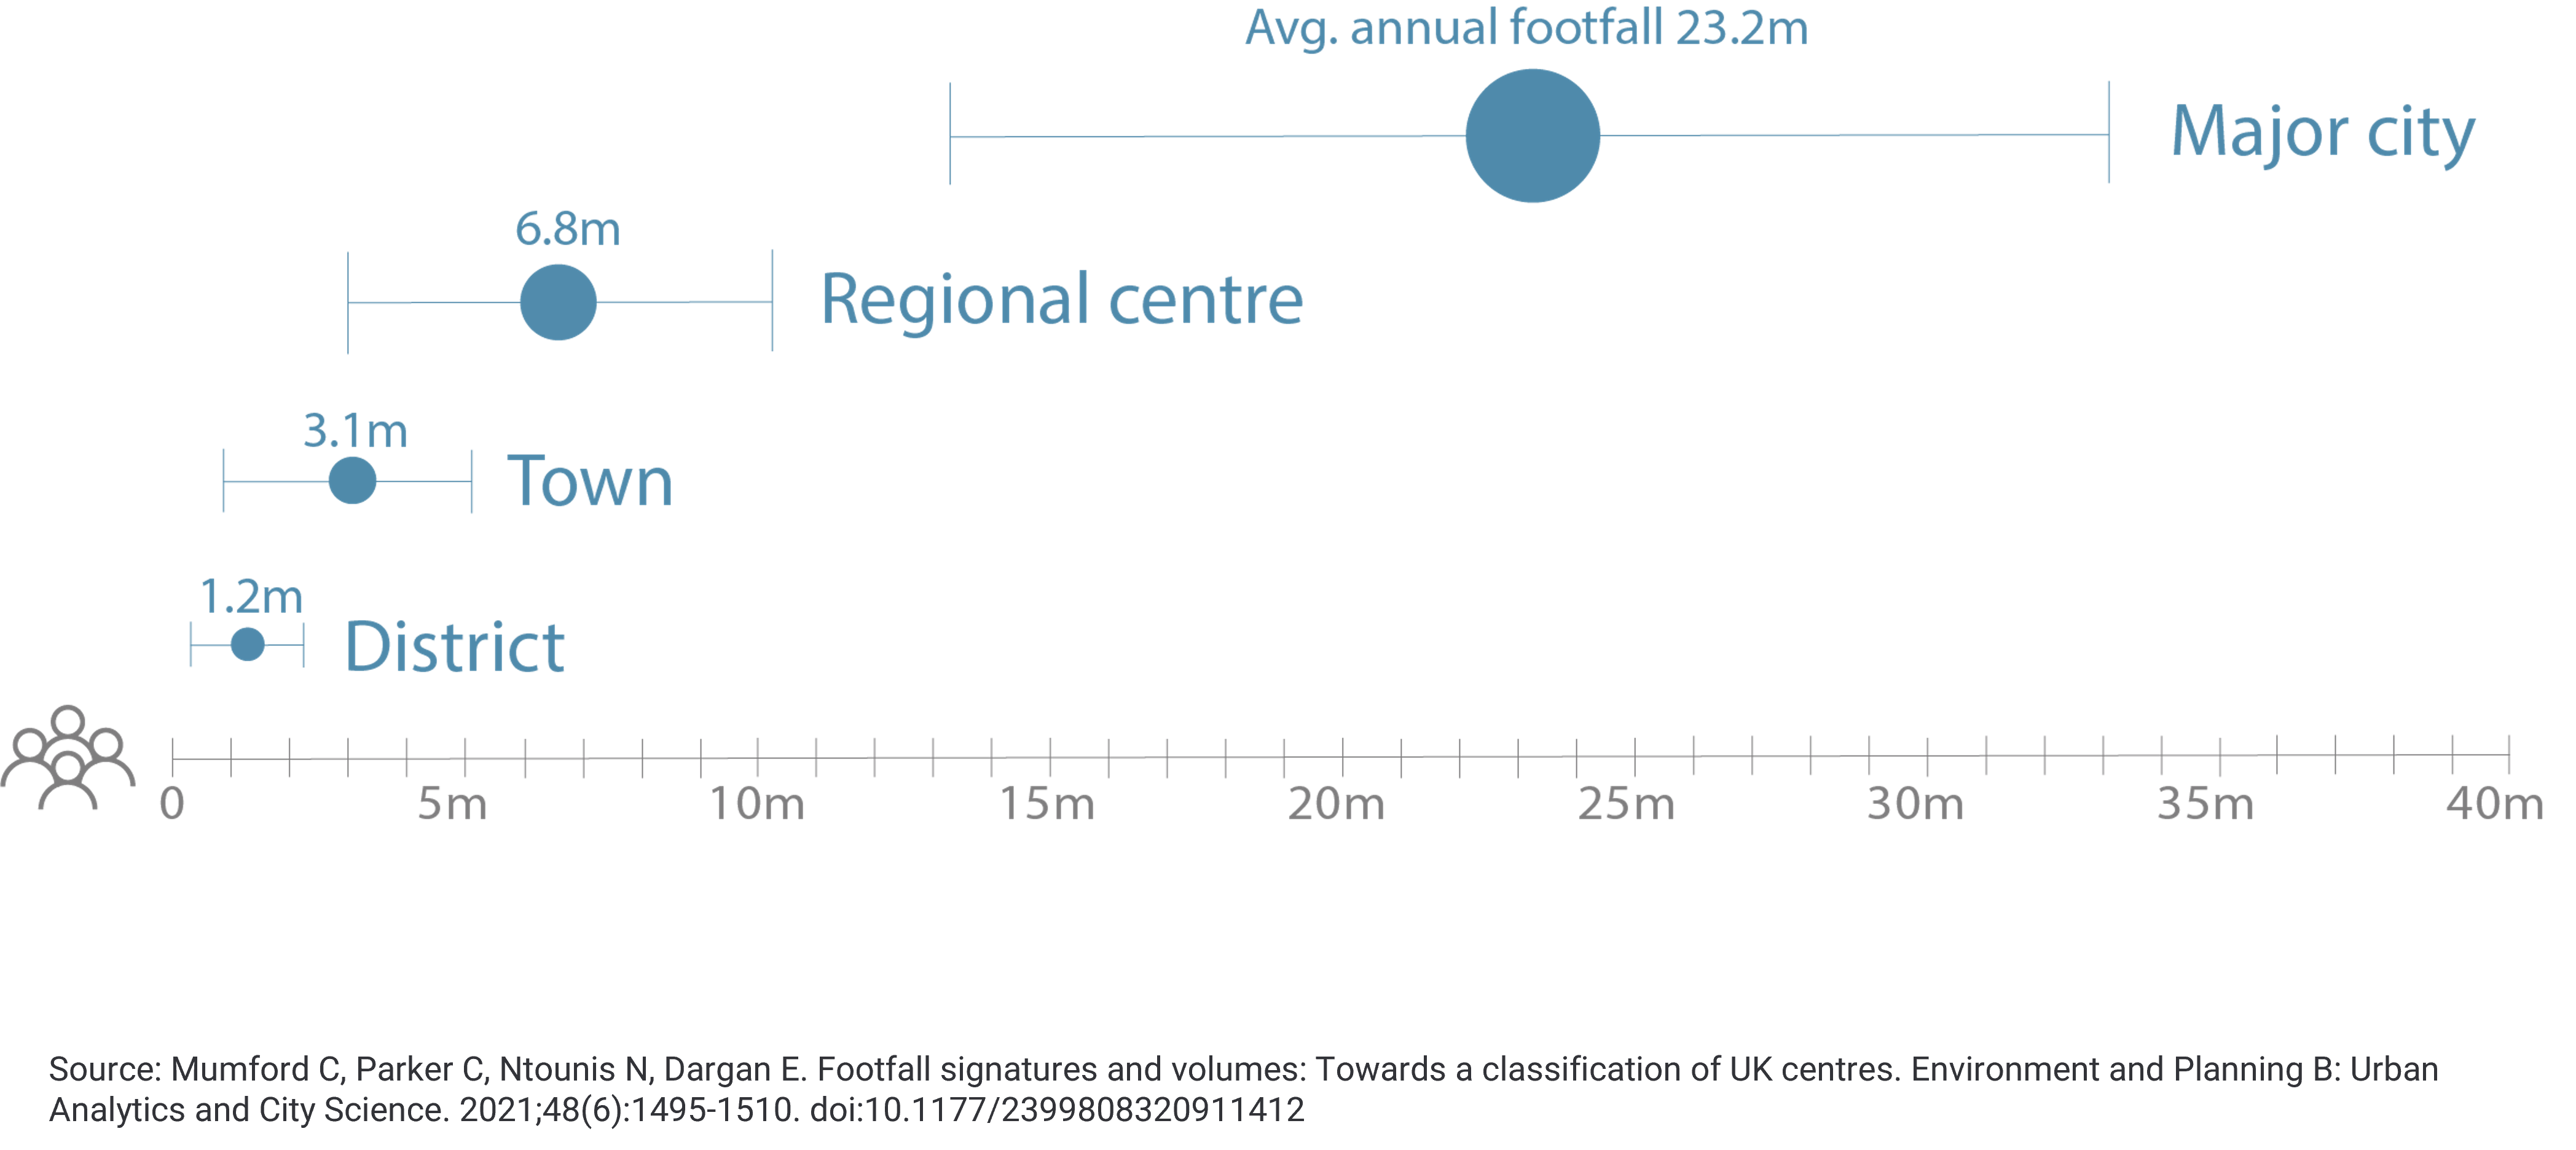
The activity hierarchy is a classification of settlement size based upon the annual volume of footfall.
The activity hierarchy uses a standard order of settlement size (Major city, Regional Centre, Town and District) but the classification of a particular town is based on its annual footfall volume only. No other factors are taken into account.
Methodology
Identify the busiest Springboard counter in the centre and use the last full year's data (Jan to Dec). This is the annual footfall figure that is used to classify the position in the activity hierarchy
Related Products
Desk Research and Reports for the Unlocking your Place Potential Programme
Reference
Mumford C, Parker C, Ntounis N, Dargan E. Footfall signatures and volumes: Towards a classification of UK centres. Environment and Planning B: Urban Analytics and City Science. 2021;48(6):1495-1510. doi:10.1177/2399808320911412
Retail Hierarchy
Definition
The retail hierarchy is a method of ranking town and city centres based on a number of characteristics including chain store representation, catchment population, retail floorspace, income, number of stores, retail sales data, number of goods available, and non-retail aspects (e.g. hospitals, colleges, football teams). These hierarchies or rankings are developed from central place theory and retail-focused gravity models but there is no standard method of ranking. In other words, one method may identify the centre as one type (e.g. sub-regional centre) and another method may identify the centre as another (e.g. town centre). A google search for retail or retail capacity studies for the place should return at least one attempt to identify the town's position on a retail hierarchy. This may (or not) be adopted as the town centre designation by the local planning authority.
Methodology
The retail hierarchy is a method of ranking town and city centres based on a number of characteristics including chain store representation, catchment population, retail floorspace, income, number of stores, retail sales data, number of goods available, and non-retail aspects (e.g. hospitals, colleges, football teams). These rankings are developed from central place theory and retail-focused gravity models but there is no standard method of ranking. In other words, one method may identify the centre as one type (e.g. sub-regional centre) and another method may identify the centre as another (e.g. town centre).
Related Products
Desk Research and Reports for the Unlocking your Place Potential Programme
Reference
Mumford C, Parker C, Ntounis N, Dargan E. Footfall signatures and volumes: Towards a classification of UK centres. Environment and Planning B: Urban Analytics and City Science. 2021;48(6):1495-1510. doi:10.1177/2399808320911412
Town Centre Designation
Definition
The Town Centre Designation is how the planning authority (the local council) has classified the town centre based on its size and function. It is a form of retail hierarchy. There is no set guidance for making designations, even though local authorities are expected to “define a network and hierarchy of centres that is resilient to anticipated future economic changes" (NPPF, paragraph 23). Many local authorities use commercial providers to help them designate their town centres, by referring to retail rankings or through undertaking retail capacity studies (looking at the existing supply of retail units and understanding the catchment or demand for the centre).
Methodology
There is no set method for undertaking a town centre designation, Many local authorities will refer to retail rankings or hierarchies constructed by commercial providers in their assessment. They may also procure a retail capacity study, which will count the number and type of retailers in the centre as well as undertaking analysis of the catchment - to understand current and future demand for the centre.
Related Products
Desk Research and Reports for the Unlocking your Place Potential Programme
Reference
Mumford C, Parker C, Ntounis N, Dargan E. Footfall signatures and volumes: Towards a classification of UK centres. Environment and Planning B: Urban Analytics and City Science. 2021;48(6):1495-1510. doi:10.1177/2399808320911412
Simplified Place Hierarchy
Definition
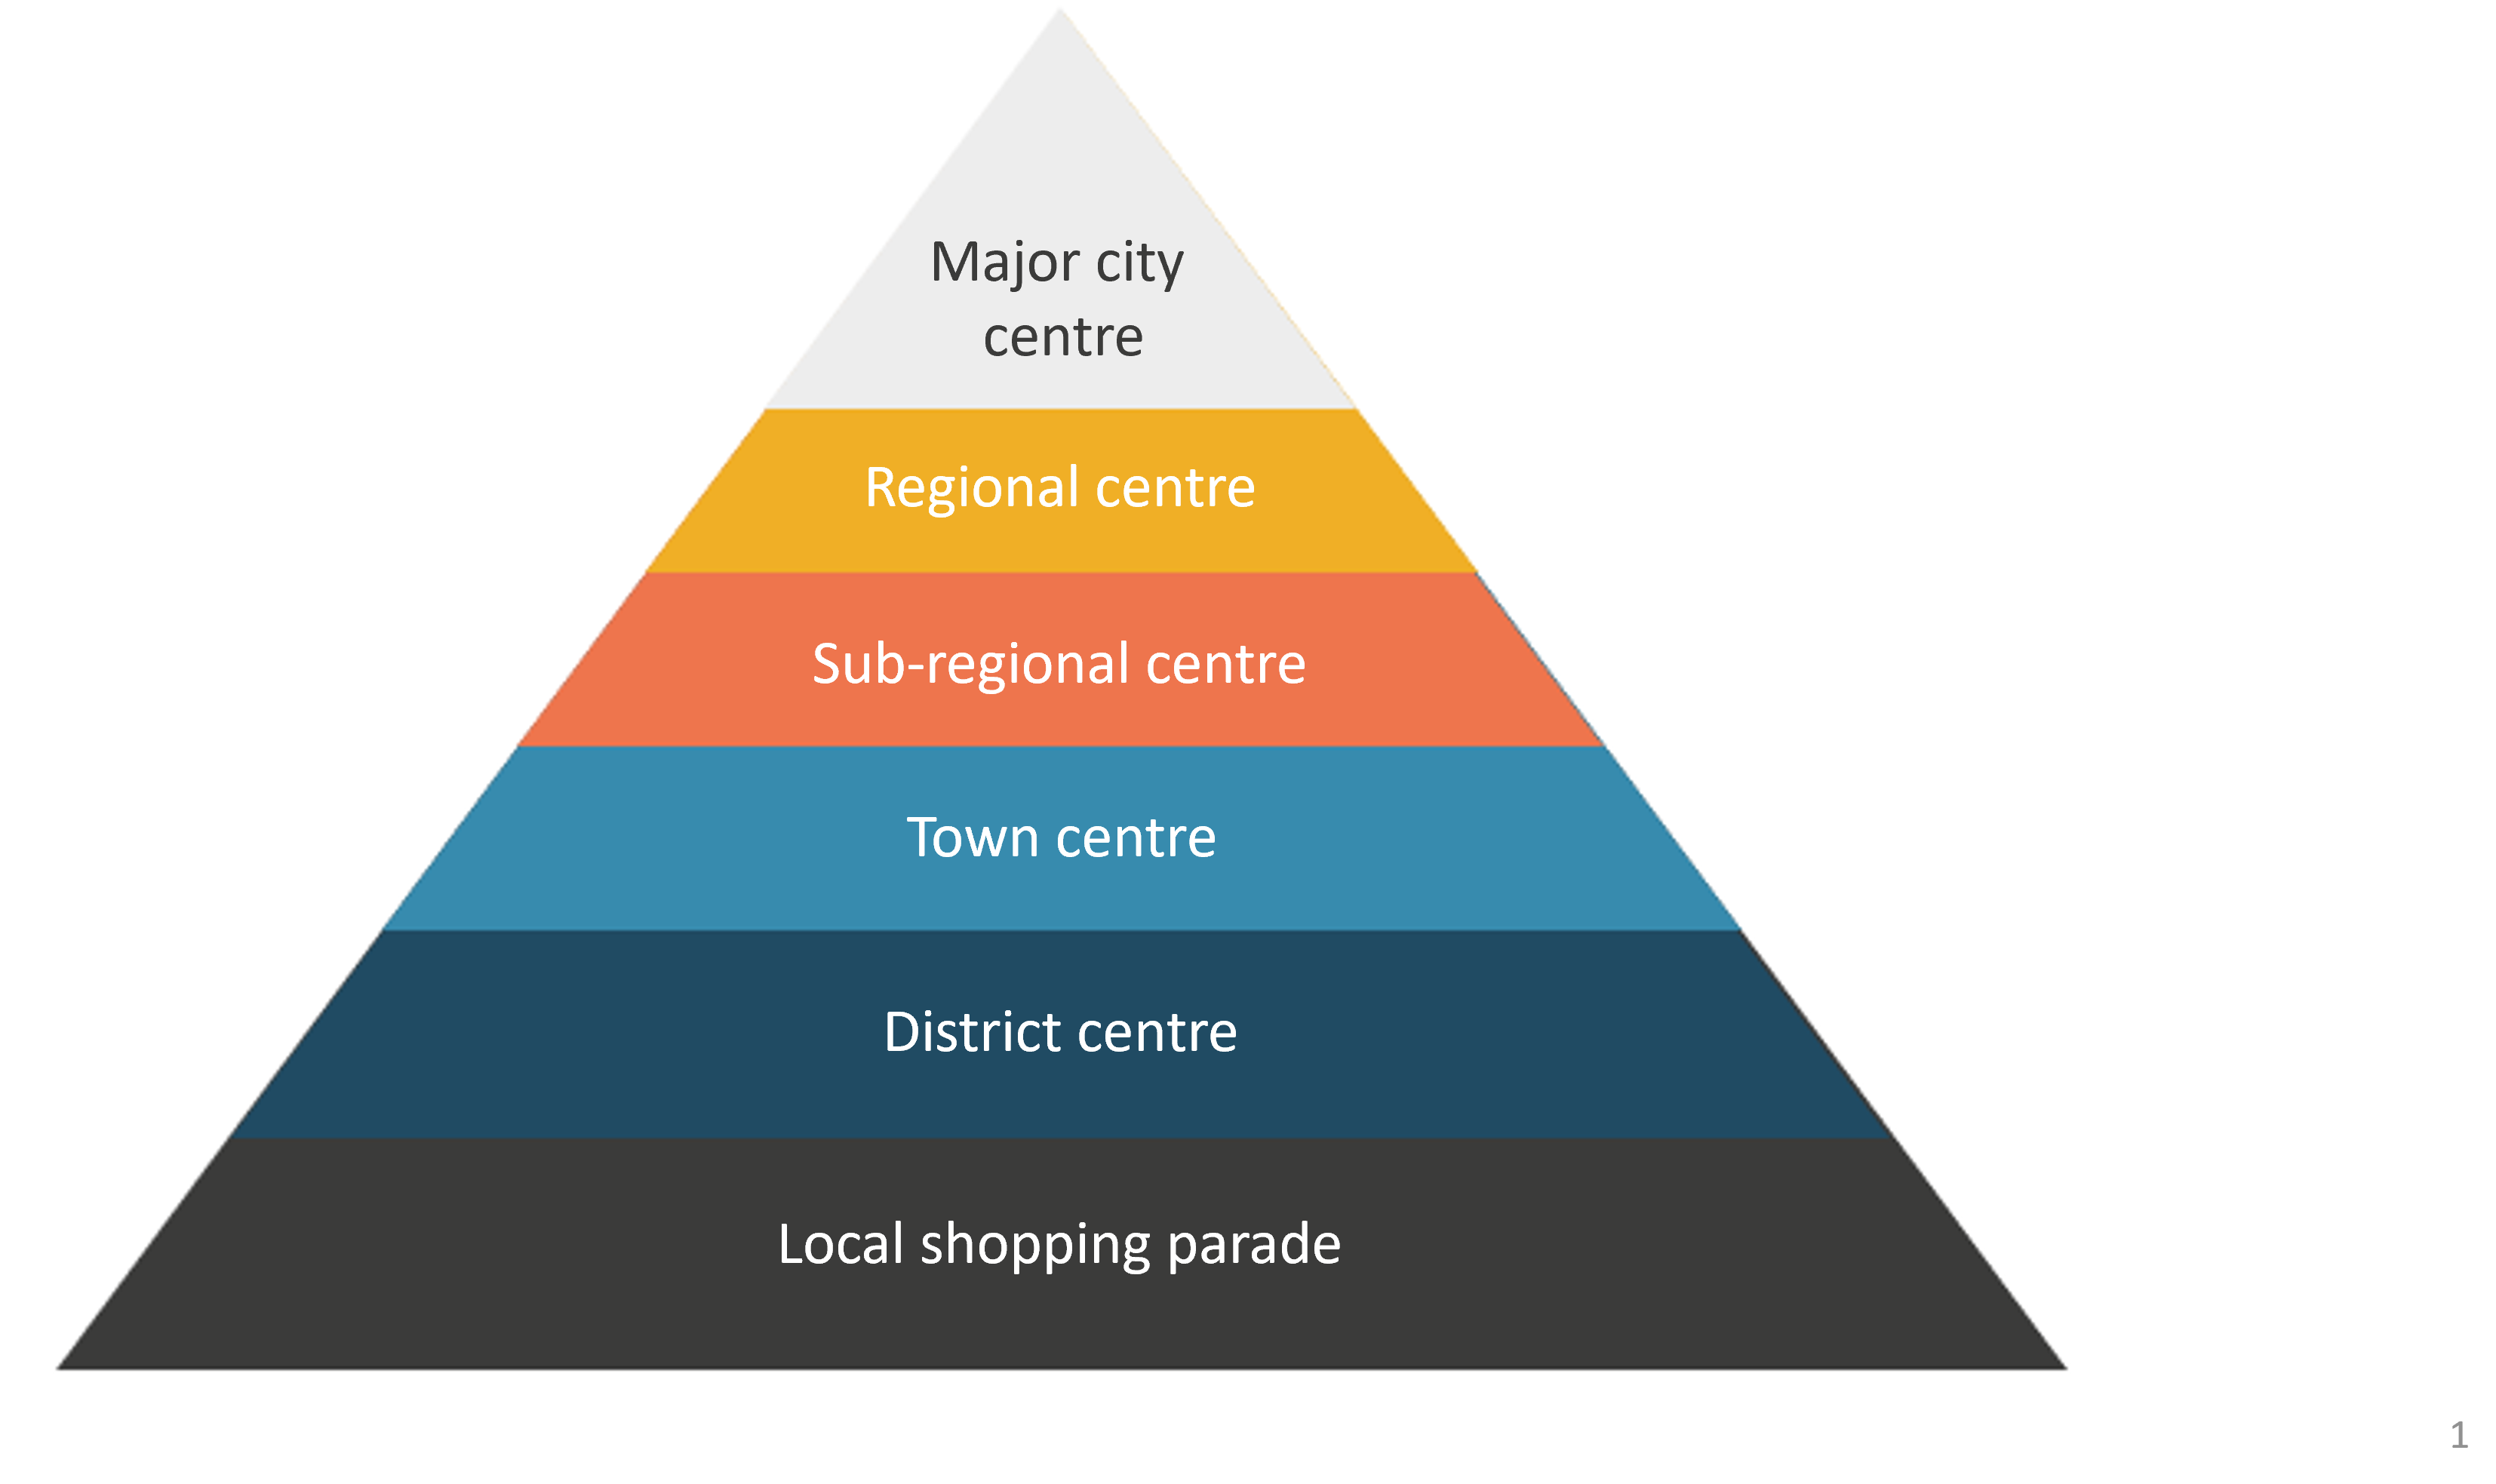
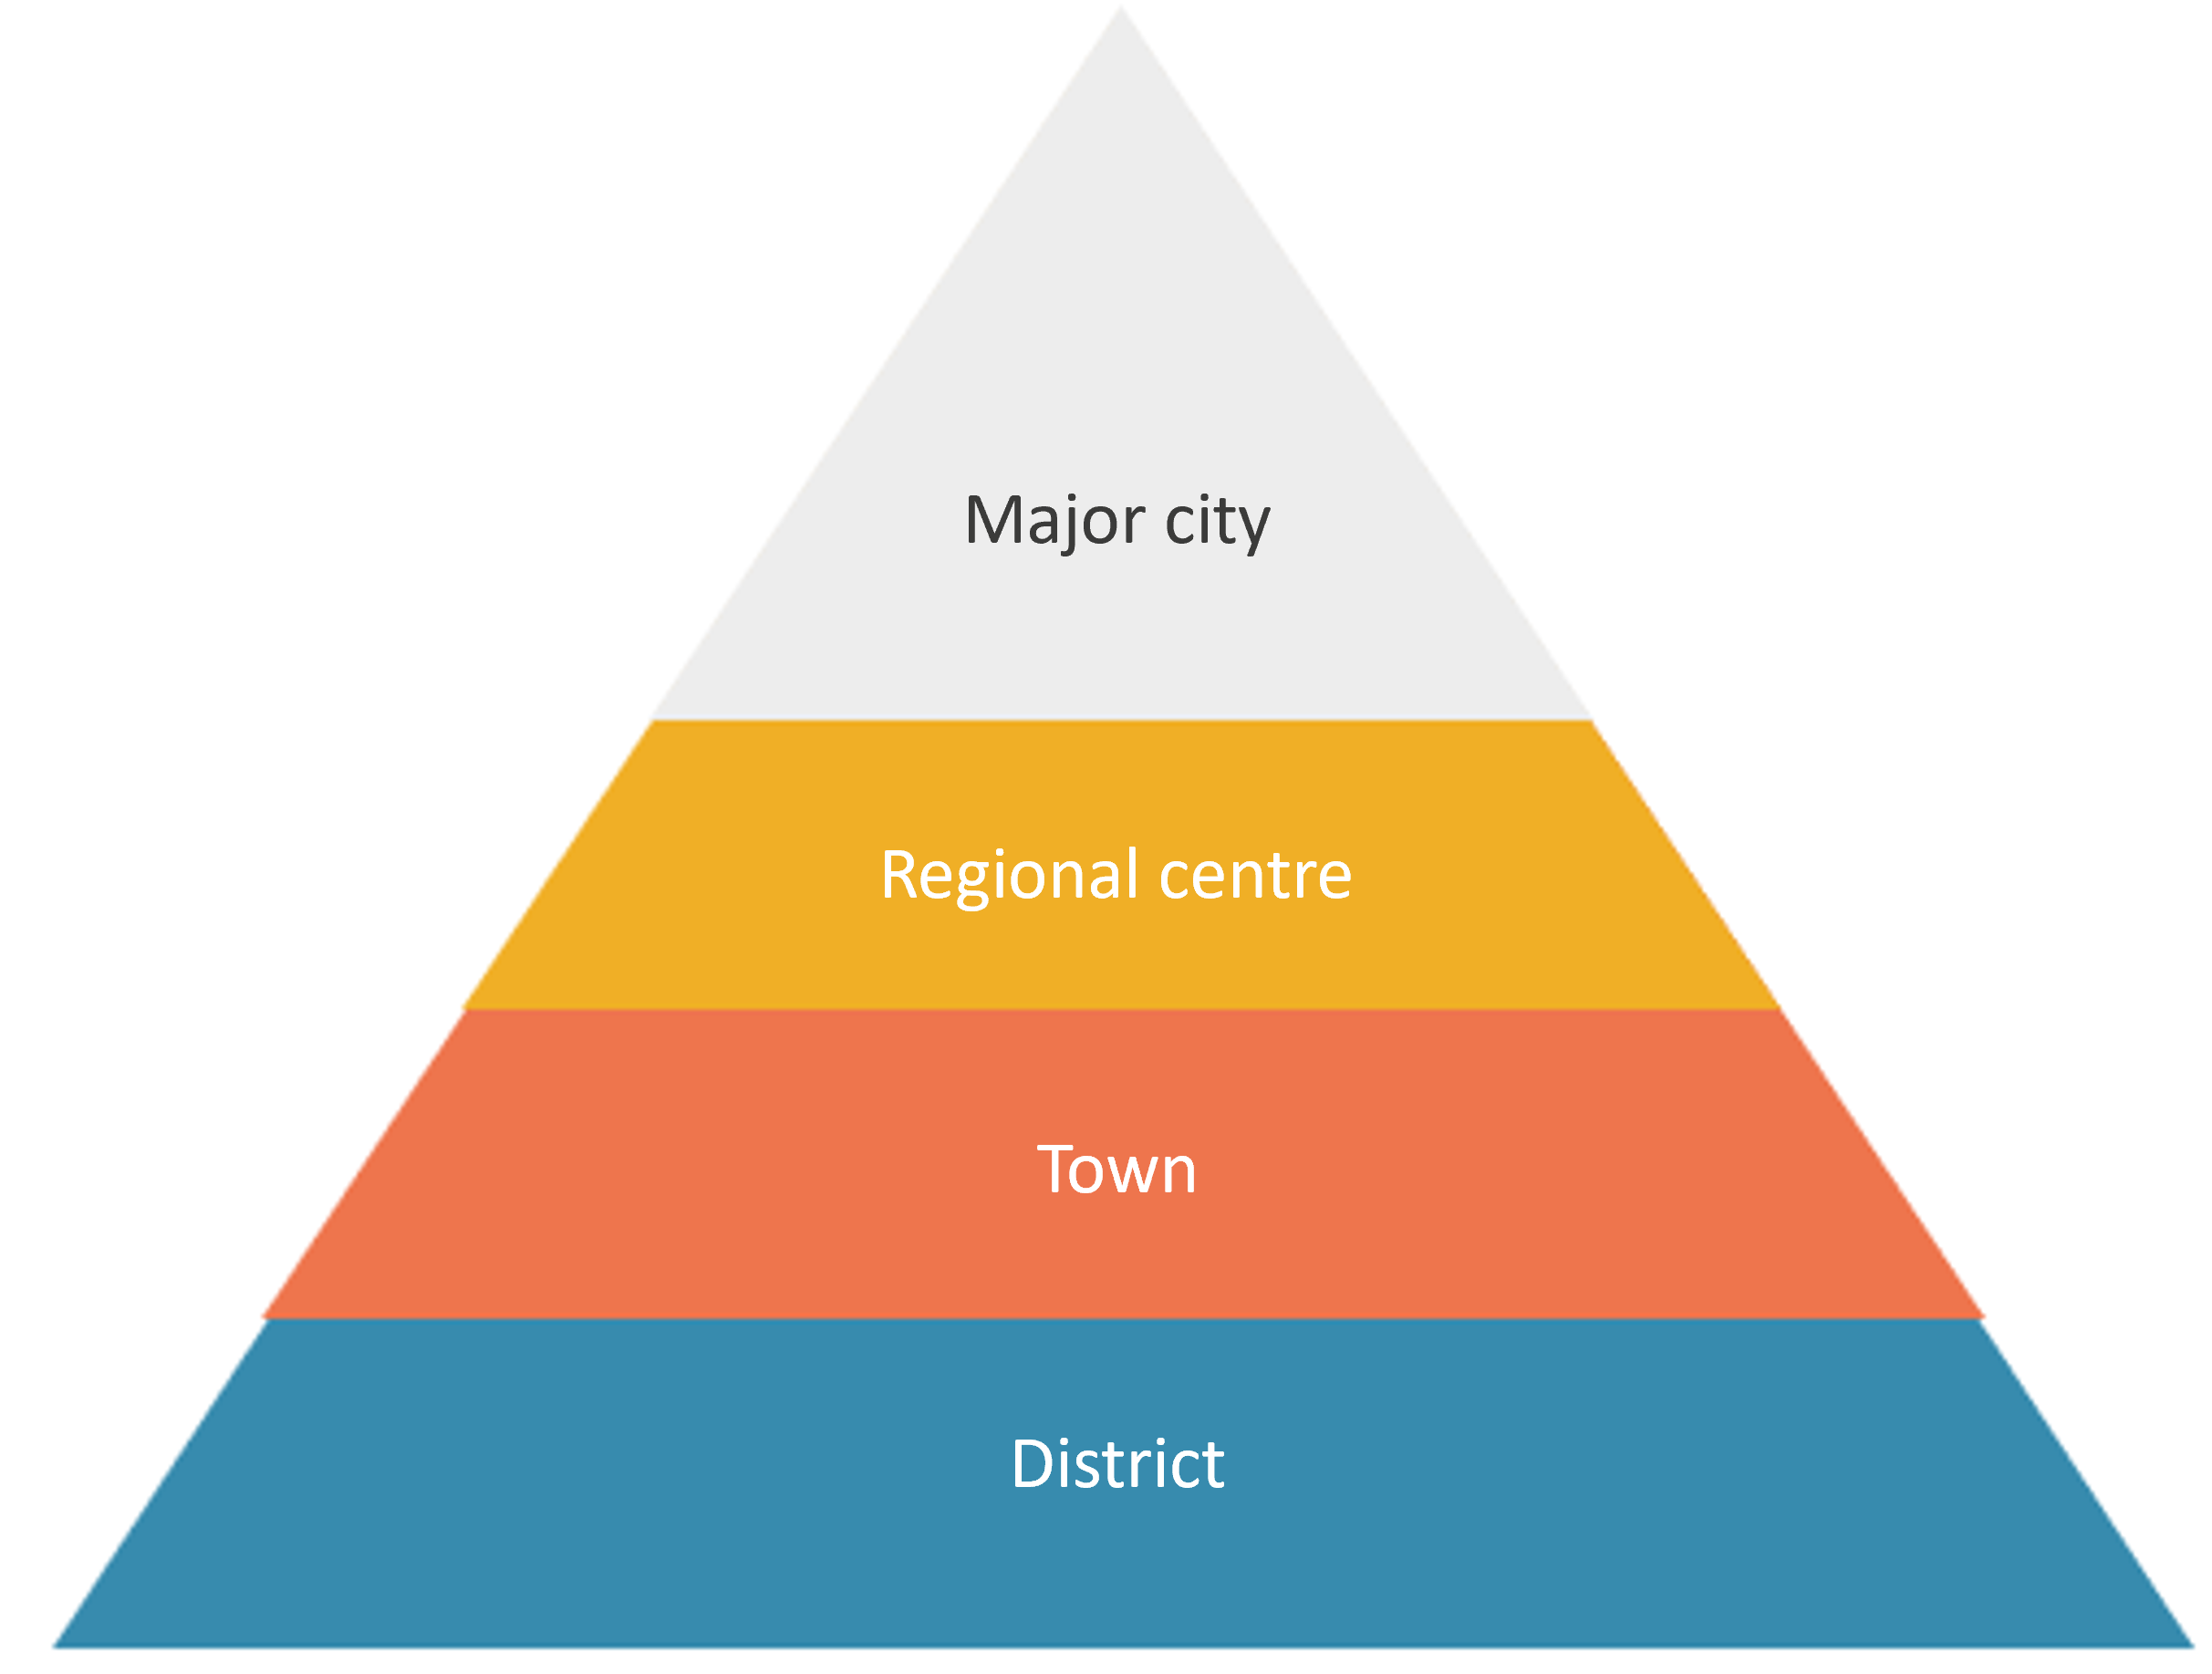
The simplified place hierarchy is a classification of settlement size which can be based on a mixture of qualitative and quantitative information including annual footfall, planning designation, retail rankings or just 'gut feeling'.
The purpose of the simplified place hierarchy is to have 'clear blue water' between different settlement sizes to increase the likelihood of a range of stakeholders (including analysts) agreeing on the same 'answer'.
The simplified place hierarchy includes the following settlement types Major city, Regional Centre, Town and District.
Methodology
The simplified place hierarchy is a classification of settlement size which can be based on a mixture of qualitative and quantitative information including annual footfall, planning designation, retail rankings or just 'gut feeling'.
Ideally a number of stakeholders would be asked to identify the position of their location in the simplified place hierarchy, using, for example, a workshop exercise or survey. The consensus majority view should then be taken as the classification.
Related Products
Desk Research and Reports for the Unlocking your Place Potential Programme
Reference
https://journals.sagepub.com/doi/full/10.1177/2399808320911412
Mumford C, Parker C, Ntounis N, Dargan E. Footfall signatures and volumes: Towards a classification of UK centres. Environment and Planning B: Urban Analytics and City Science. 2021;48(6):1495-1510. doi:10.1177/2399808320911412
Annual Footfall Signature
Definition
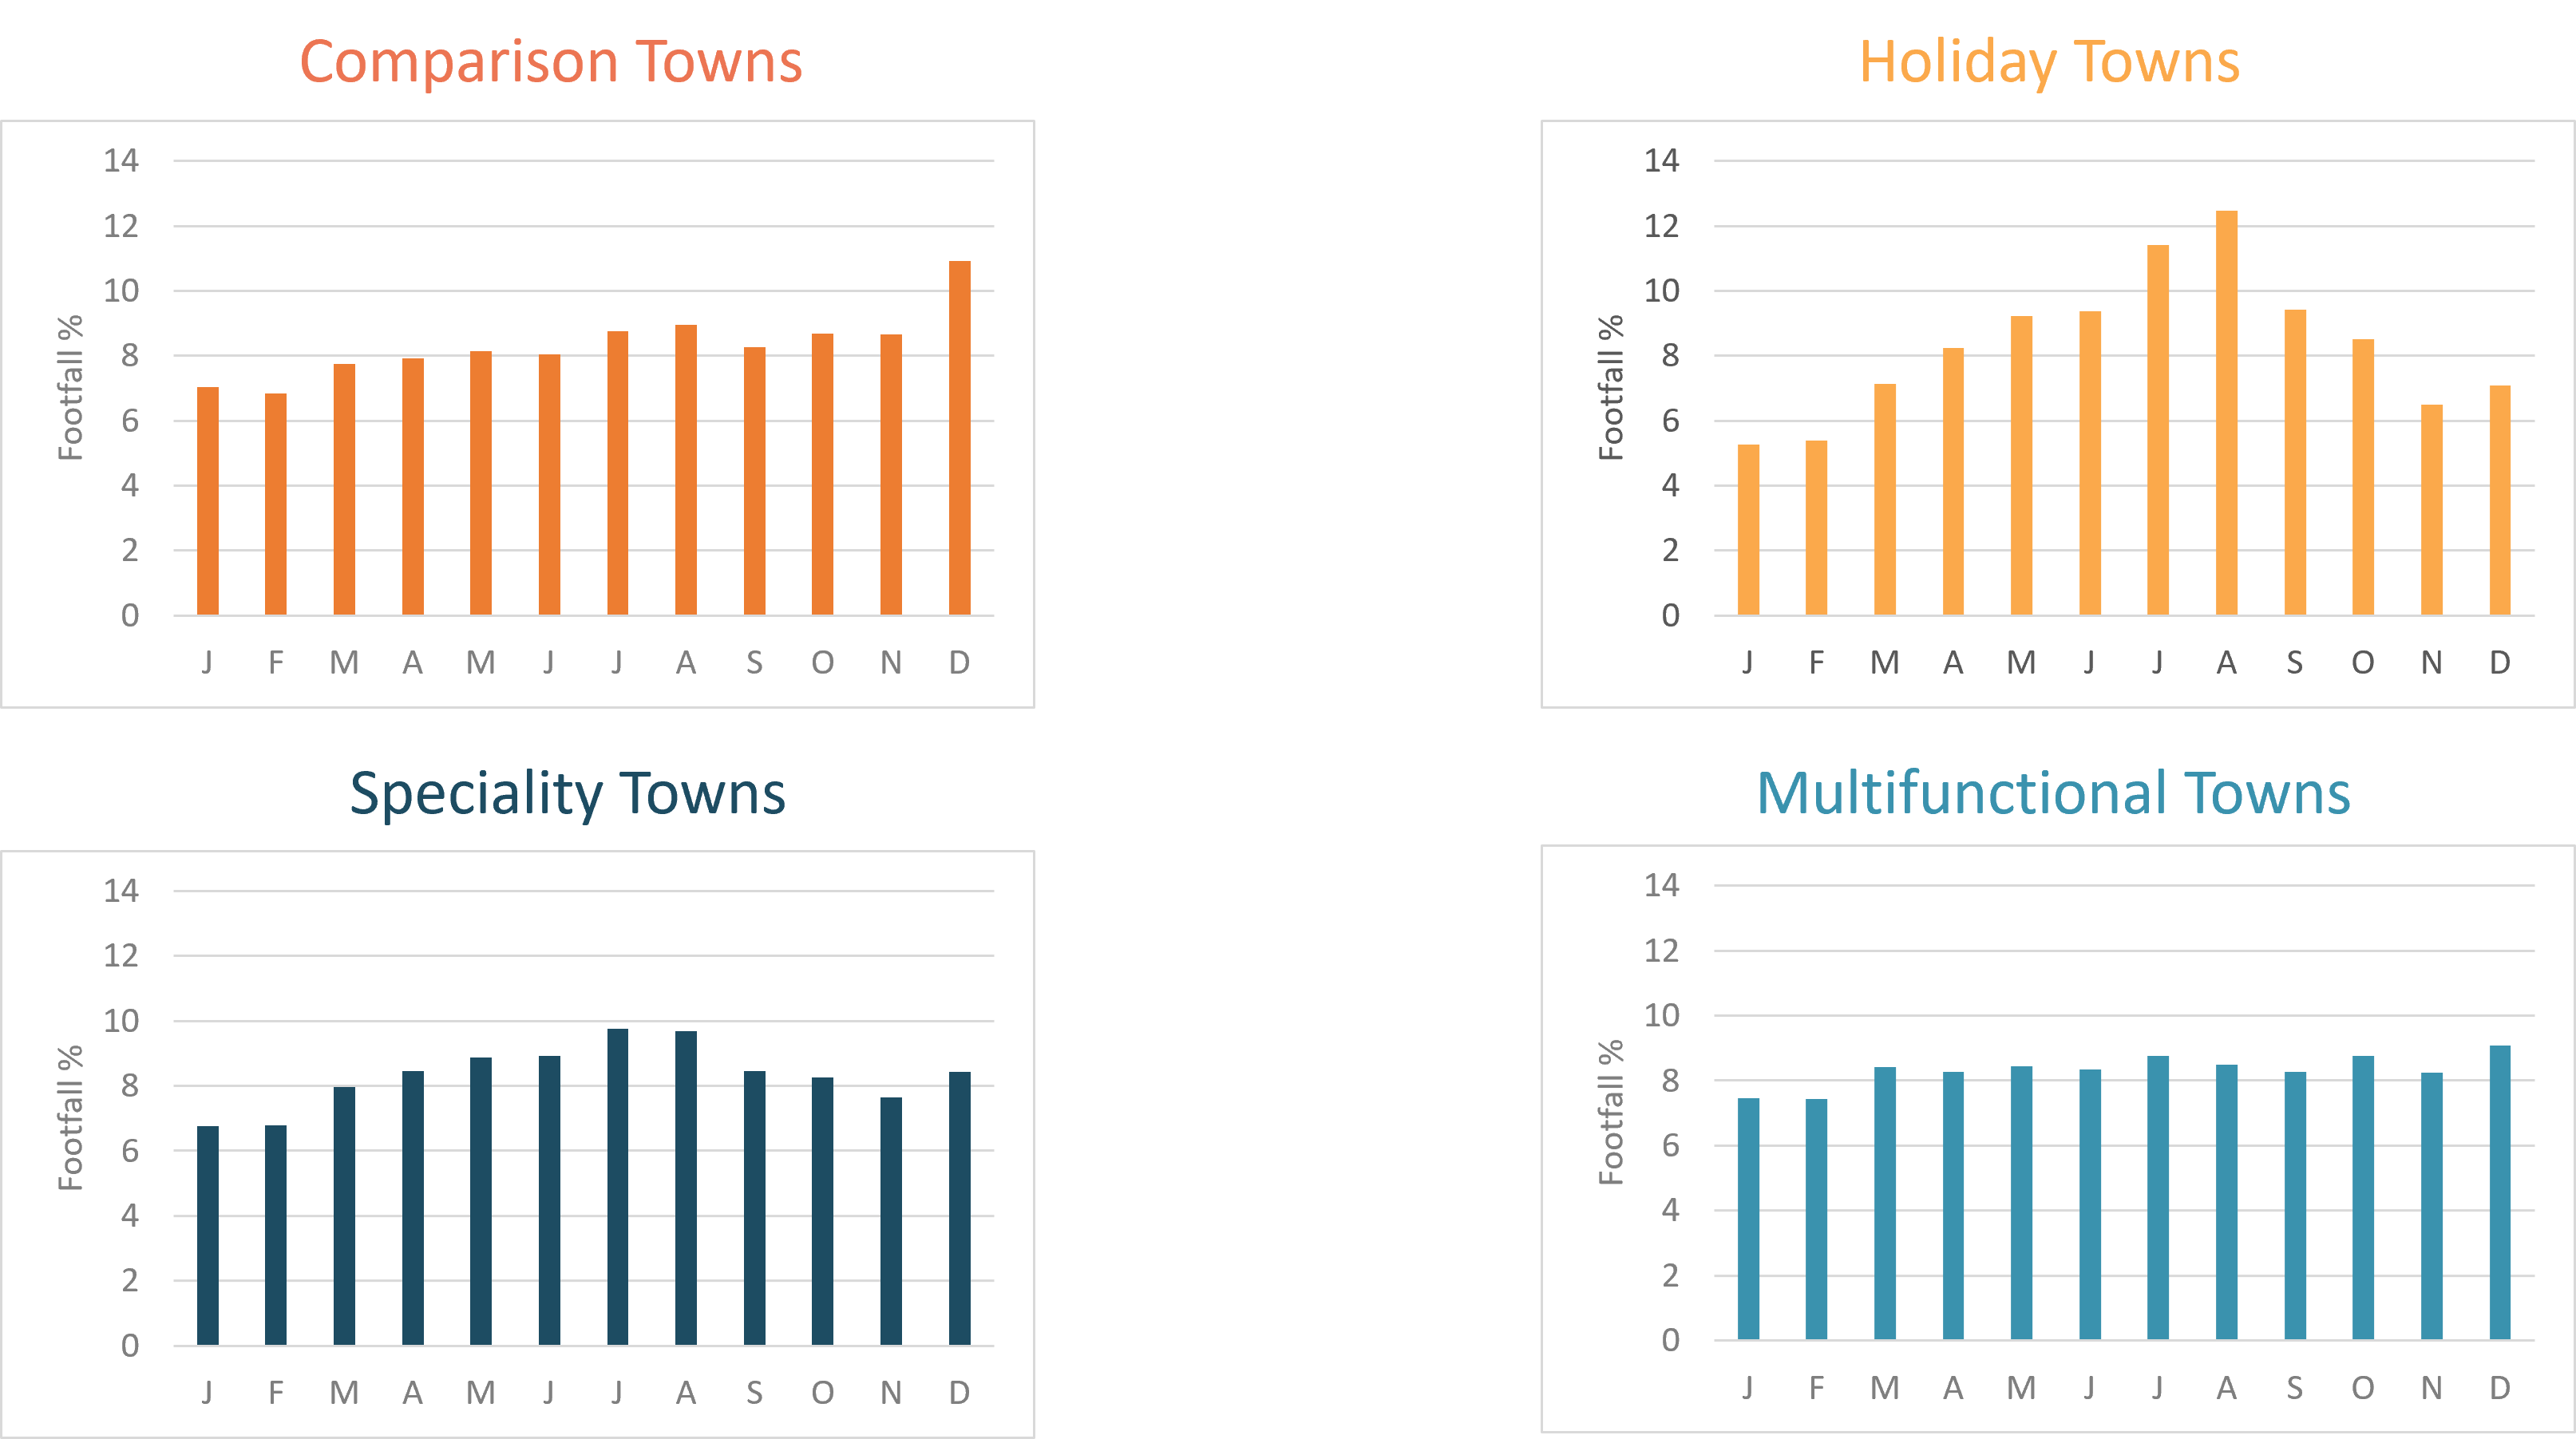
Annual footfall signatures are a way of classifying town, city and neighbourhood centres by comparing how footfall volumes vary over the months of the year. They are a useful way of identifying the dominant function of a town. Unlike traditional methods of classifying towns, which are based on their offer, footfall signatures are derived from patterns of usage. This makes them very current and can help place managers and leaders identify how a town or city may be changing. Although each town will have its own unique pattern of usage over the months of the year, we can identify four distinct signature types.
Comparison towns are the more traditional shopping centres, typically located in larger town and city centres. They are characterised by a footfall peak in December, coinciding with the Christmas preparation period. People visit predominantly to shop and often travel a considerable distance to visit. These centres have a wide range of retail choice, leisure, food and beverage, as well as strong retail anchor(s) and presence of multiples and international brands.
Holiday towns are visited mainly by tourists for a holiday or a ‘day out’. They do not ordinarily concentrate on serving the local catchment, instead focusing on providing entertainment and leisure for visitors for people that travel a considerable distance to visit. They are busiest in the summer and when the weather is good. They are attractive to tourists but have relatively weak comparison offer, hence are very quiet during the winter months.
Speciality towns attract tourists but also serve the local population. Like holiday towns they are busiest in the summer months, but also show a (smaller) second footfall peak in December, indicating a ‘hybrid’ type between holiday and comparison towns. These towns have anchors that are not linked to retail (e.g. heritage and culture), offer something unique and special, promoting a strong town identity. The smaller footfall peak indicates that they are popular in the run-up to Christmas, for a day out or short break that combines leisure with some gift shopping.
Multifunctional towns are a diverse group, coming in many shapes and sizes, and serve a variety of everyday needs, such as convenience shopping, leisure, and employment. They are characterised by a flat footfall profile throughout the months of the year. The volumes of footfall are indicative of the catchment areas these people are drawn from, so large multifunctional centres (cities) are drawing people from a wider area than the small multifunctional centres (towns), that are serving a local catchment. Larger multifunctional towns may drive regional economies, or are important centres serving a well-defined hinterland. They have anchors like professional services or financial centres, universities, major transport hubs etc. They are nationally and sometimes internationally connected.
Methodology
Annual footfall signatures are calculated through a statistical analysis (K-Means clustering) of over 10-years of footfall data from over 100 retail centres provided by Springboard. The clustering algorithm identifies four distinct signature types, based on how footfall varies by month. With signature types we are interested in the percentage difference in footfall across the months, rather than actual footfall volumes. This allows us to compare towns and cities of different sizes because we are interested the patterns of visitation, rather than the number of visitors. Our classification of towns and cities based on footfall volumes (rather than footfall signatures) can be found in the Activity Hierarchy.
Related Products
Desk Research and Reports for the Unlocking your Place Potential Programme
Reference
Mumford C, Parker C, Ntounis N, Dargan E. Footfall signatures and volumes: Towards a classification of UK centres. Environment and Planning B: Urban Analytics and City Science. 2021;48(6):1495-1510. doi:10.1177/2399808320911412
https://journals.sagepub.com/doi/full/10.1177/2399808320911412
Weekly Footfall Signature
Definition
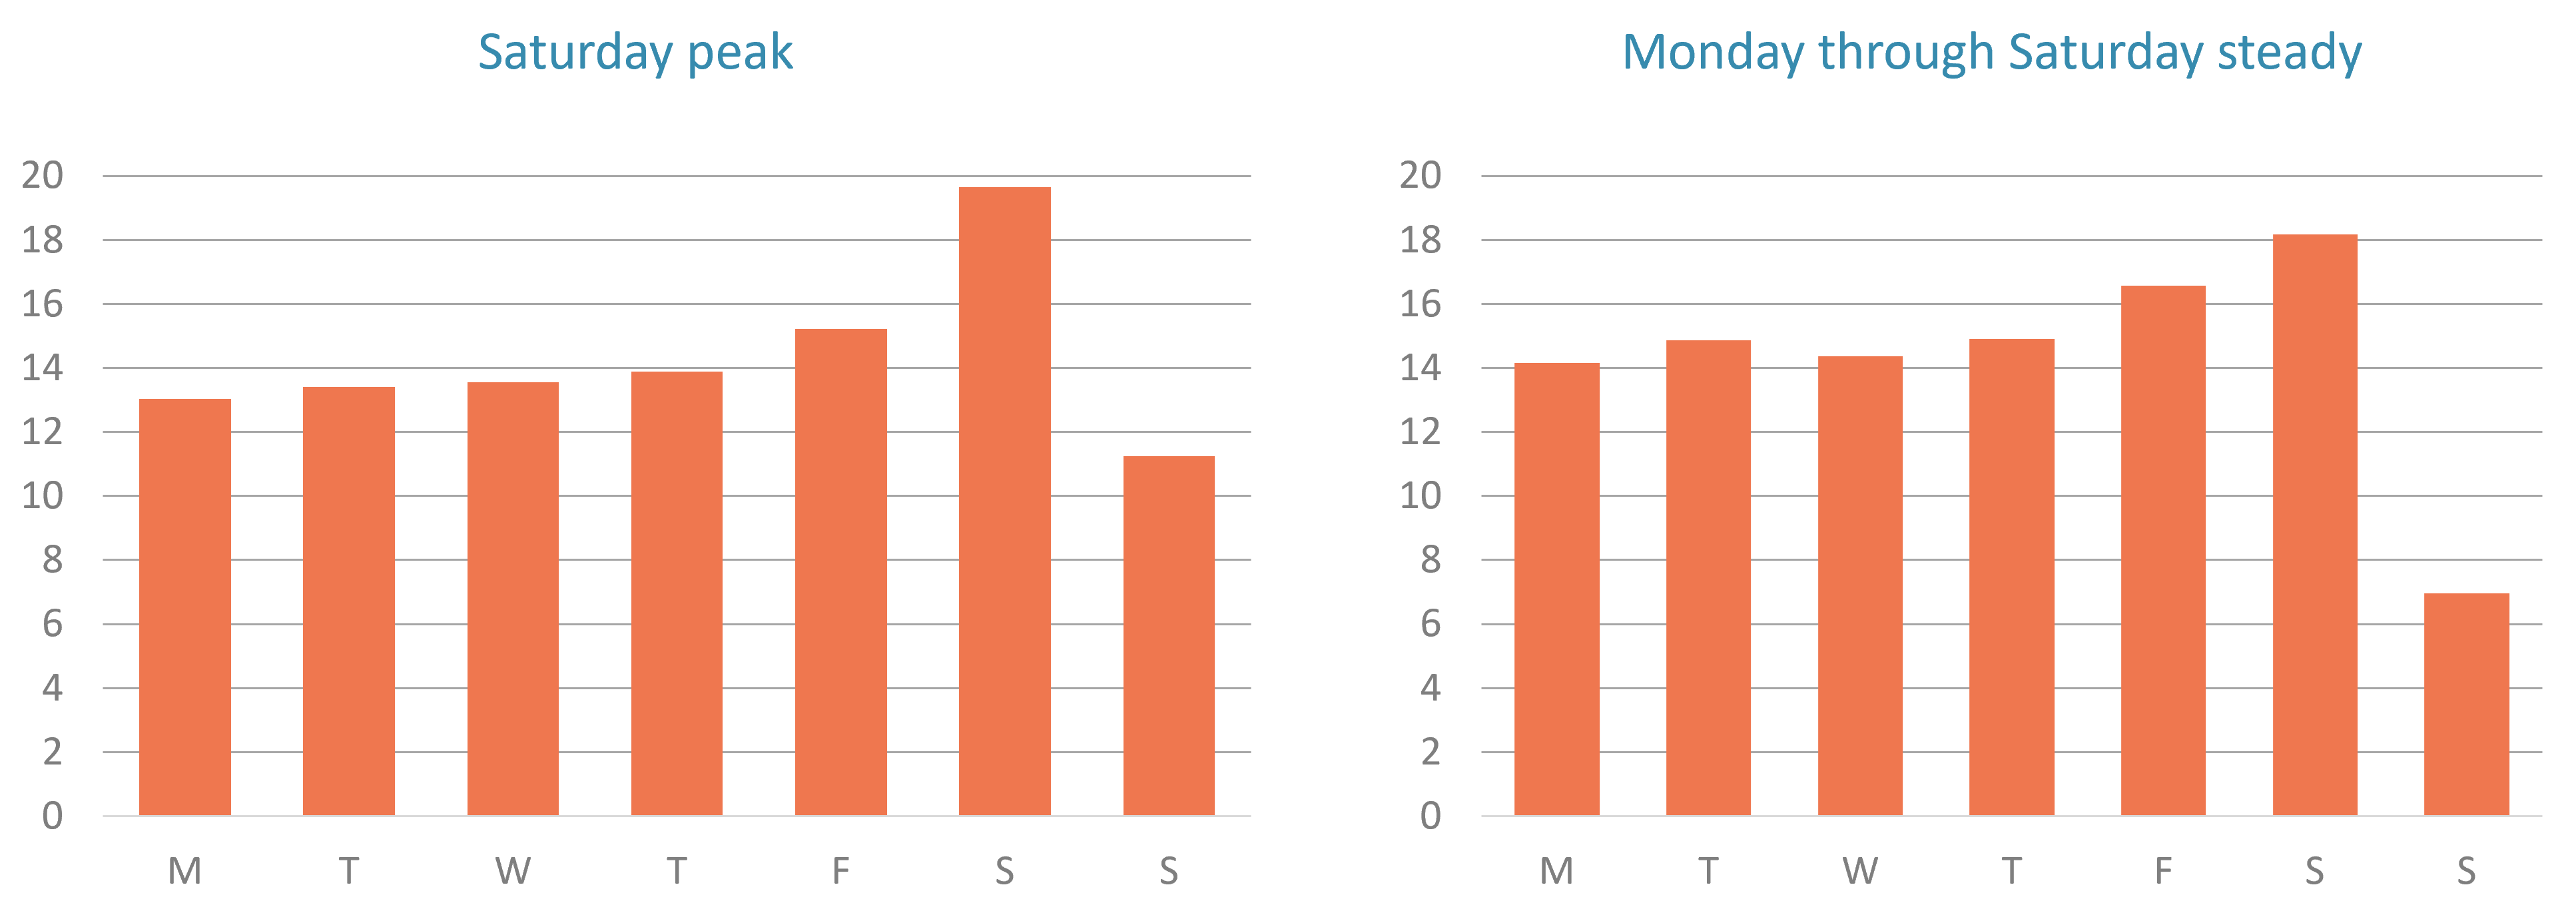
Weekly footfall signatures classify centres by activity levels, and how footfall varies over the days of the week. Weekly footfall signatures are calculated through a statistical analysis (K-Means clustering) of over 10-years of footfall data across over 100 retail centres provided by Springboard. There are two types of weekly footfall signatures:
Saturday peak type towns show a big peak on Saturday followed by a smaller drop on Sunday. Saturday peak tend to be smaller locations that are quiet in the week.
Monday through Saturday steady type towns show steady footfall from Monday to Friday with a slight peak on Saturday, followed by a large drop on Sunday. These towns tend to be busier in the week as employment centres.
Methodology
Identify the busiest Springboard counter in the centre and use the last full year's data (Jan to Dec). Look at the bar chart showing weekly footfall pattern and compare it to the two weekly signatures. Which one resembles the activity pattern in your town the closest? Alternatively, any footfall counter you are infested in can be looked at, or an average taken from all the footfall counters in the town.
Related Products
Desk Research and Reports for the Unlocking your Place Potential Programme
Reference
2020-21 Review of High Street Footfall in England:
Daily Footfall Signature
Definition
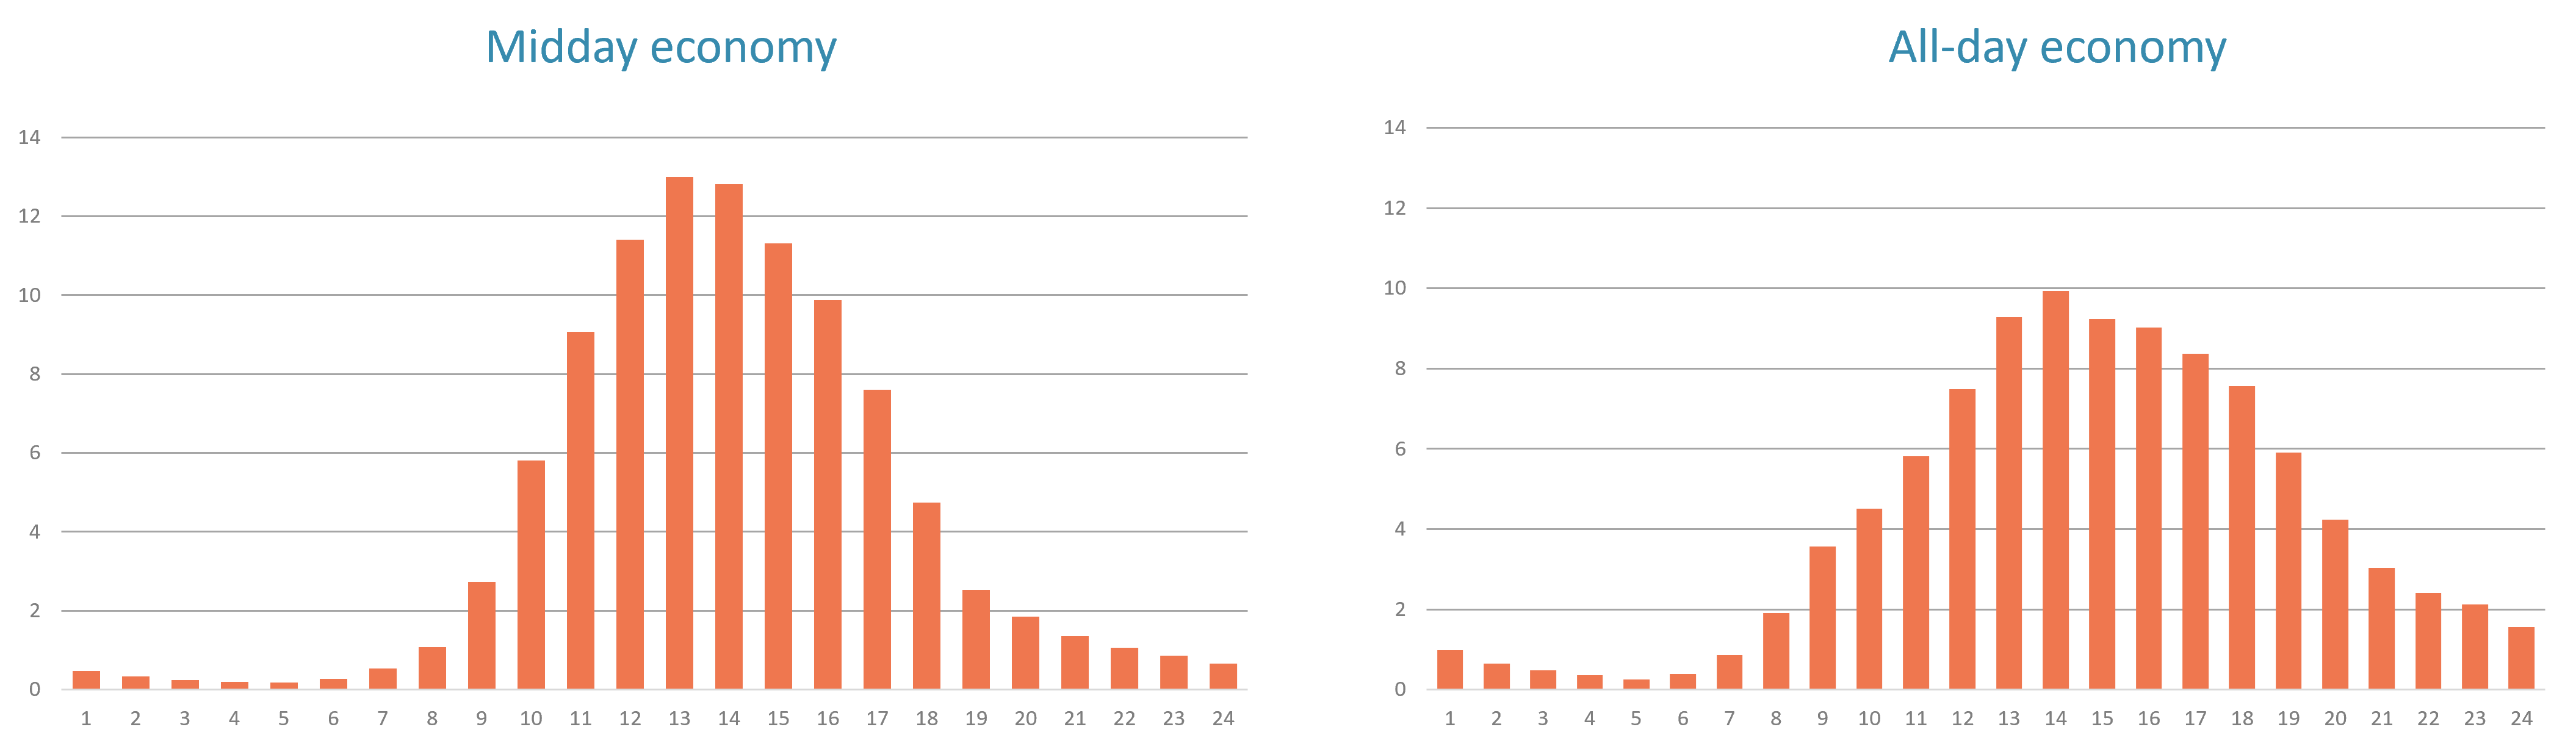
Daily footfall signatures classify centres by activity levels, and how footfall varies over the hours of the day. Daily footfall signatures are calculated through a statistical analysis (K-Means clustering) of over 10-years of footfall data across over 100 retail centres provided by Springboard. There are two types of daily footfall signatures:
All-day economy type towns show different activity peaks throughout the day. They have more customers towards lunch time and afternoon rush hour, and footfall volume differences are not as pronounced across different times of the day.
Midday economy type towns show one clear activity peak around midday. These locations attract footfall based on their lunchtime offer and these towns are much quieter at night.
Methodology
Identify the busiest Springboard counter in the centre and use the last full year's data (Jan to Dec). Look at the bar chart showing daily footfall pattern and compare it to the two daily signatures. Which one resembles the activity pattern in your town the closest? Alternatively, other Springboard counters can be examined or average footfall taken from all the counters in the town can be used.
Related Products
Desk Research and Reports for the Unlocking your Place Potential Programme
Reference
2020-21 Review of High Street Footfall in England:
Estimated Footfall Data
Definition
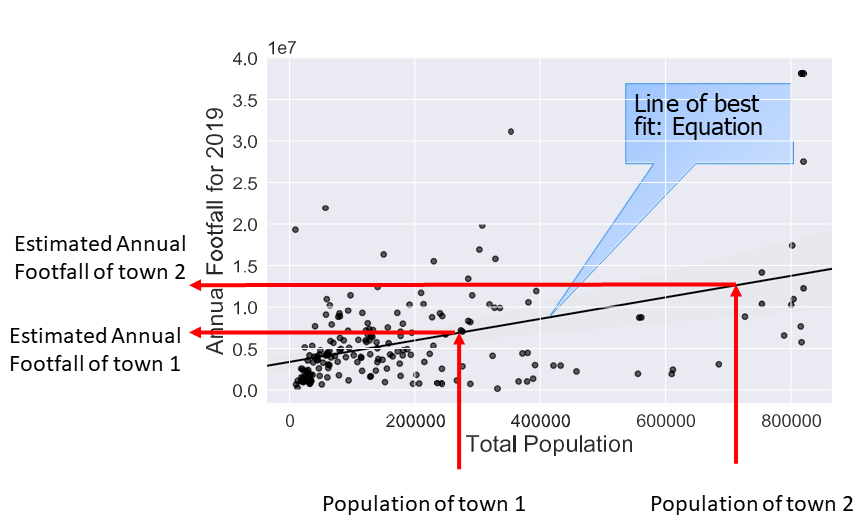
Estimated footfall data is a very rough estimate of what annual footfall might be in a (town/district/city) centre based on catchment population (in a 3 mile radius) and averages from other towns.
The footfall estimator has been developed based on hourly footfall data from about 200 UK towns (provided by Springboard). Population and geographic data has been obtained for the 2011 UK Census from the Office for National Statistics (ONS).
Estimating footfall data involves (1) establishing the location(s), size, and geographic boundary of each centre; and (2) a regression equation to convert catchment population into footfall.
Methodology
Access your standard dashboard and find out your estimated annual footfall volume as well as the hourly pattern for the whole year.
Related Products
Manual footfall counting programme
Desk Research and Reports for the Unlocking your Place Potential Programme
Reference
Summary of Footfall Estimator for the Institute of Place Management
Calibrated Footfall Data
Definition
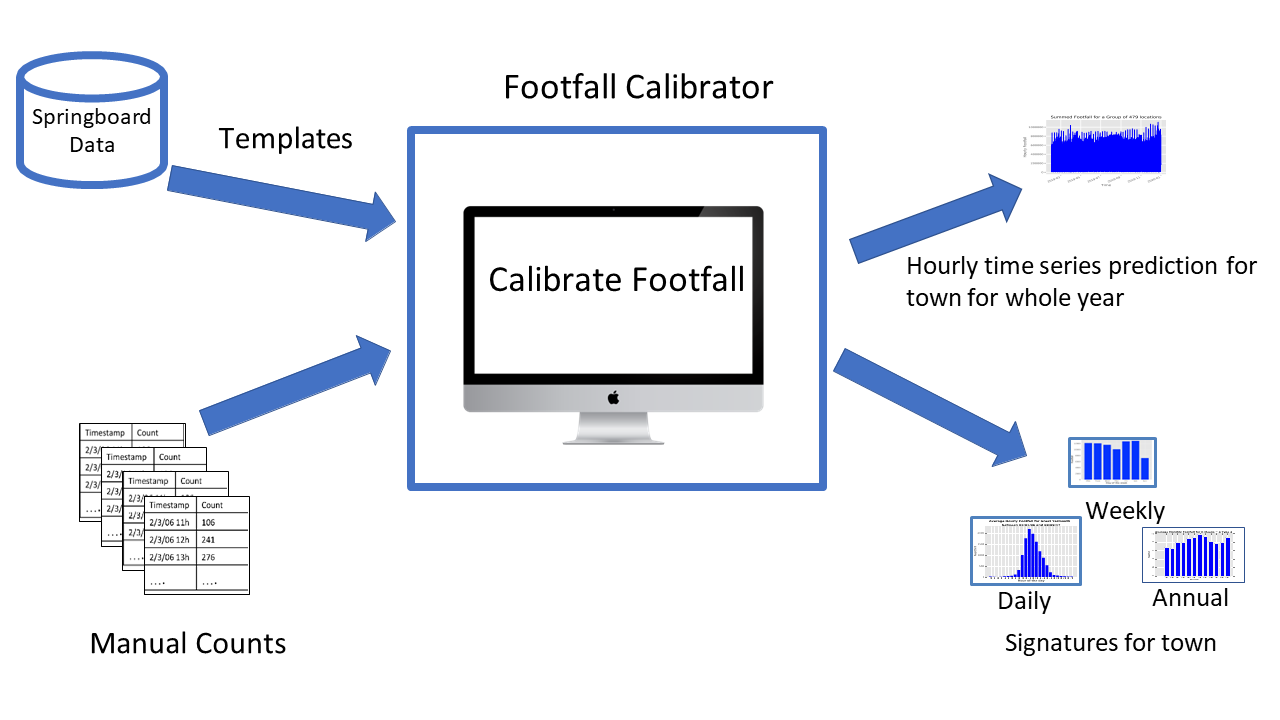
Calibrated footfall data is a more accurate estimate of footfall (than estimated footfall data) for a (town/district/city) centre, as it is modelled on a set of actual manual footfall counts. It looks up counts for the same months of the year, hours of the day, and days of the week for towns with Springboard counter, fills in the gaps and then estimates the annual, weekly and daily signatures plus the total annual footfall for each town. In addition, an hour-by-hour prediction is computed for the entire year.
Methodology
Manual footfall counts are collected for:
Days: Tuesday, Saturday, and Sunday.
Times: 7-9am, 12-14pm, and 17-19pm.
Months: March, August, December.
These are sent to the HSTF for calibration. Annual calibrated footfall as well as patterns can be found on the Standard dashboards.
More about manual footfall counting can be found here: https://squidex.mkmapps.com/api/assets/ipm/guidance-for-manual-footfall-counting-regime.pdf.pdf
Manual footfall counting programme
Desk Research and Reports for the Unlocking your Place Potential Programme
Reference
Summary of Footfall Estimator for the Institute of Place Management
Indices of Multiple Deprivation
Definition
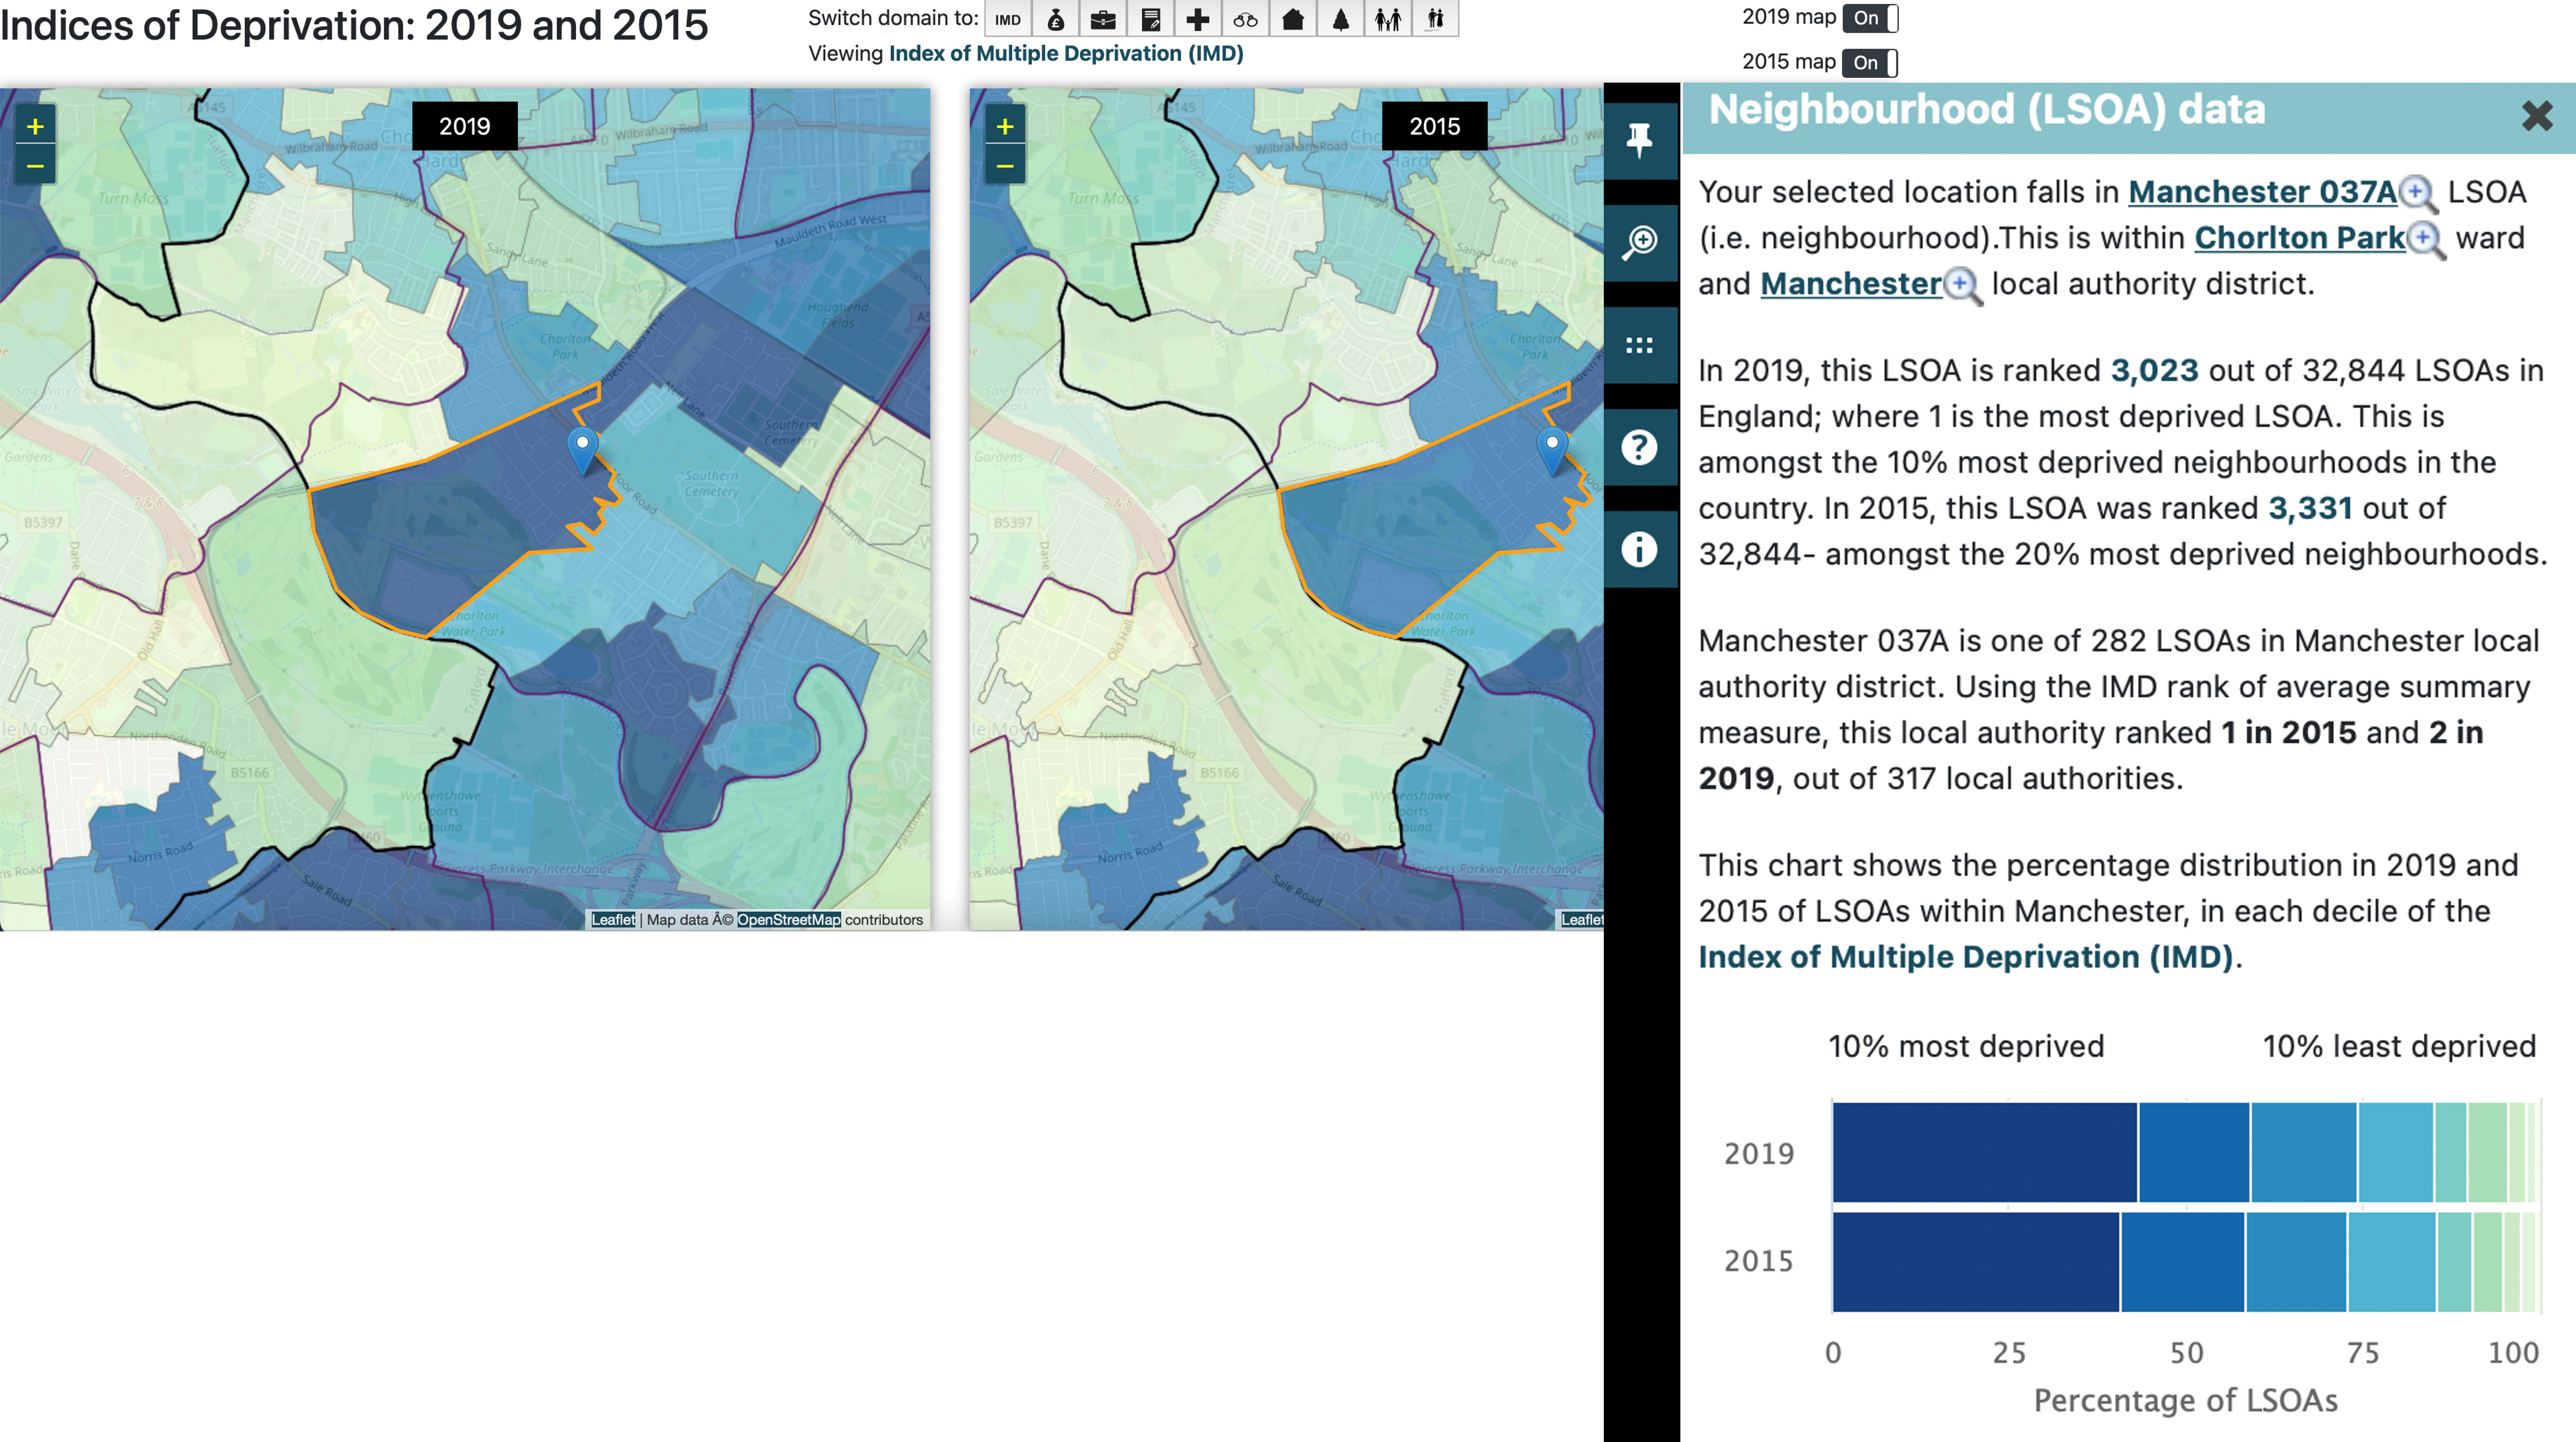
The English Indices of Deprivation (IoD) are produced by the Ministry of Housing, Communities & Local Government (MHCLG). The latest statistical release is from 2019.
The IoD are comprised of seven distinct domains of deprivation that measure living conditions in different neighbourhoods. When these are combined and weighted – Income (22.5%), Employment (22.5%), Health (13.5%), Education (13.5%), Crime (9.3%), Barriers to Housing and Services (9.3%), Living Environment (9.3%) – they form the Index of Multiple Deprivation (IMD 2019), an overall measure of how deprived an area is.
The IoD measure relative levels of deprivation in 32,844 Lower-layer Super Output Areas (LSOA), i.e. small areas or neighbourhoods, in England. These areas vary in extension as they are established so that they encompass similar population sizes (minimum 1000 and mean is 1500).
Methodology
Information about the Index of Multiple Deprivation produced in 2019 (IMD2019) as well as the seven domains of deprivation is publicly available and can be retrieved here. (Note that there first seven domains listed on the map make up the components of the IMD score, whilst the final two: IDACI and IDAOPI, are supplementary indices describing how children and older people, respectively, are affected by income deprivation.)
Locations can be selected based on postcode, local authority, or place name. Generally, a Local Authority will be composed of various Lower Layer Super Output Areas (LSOAs), but in describing the deprivation in the high street, the LSOA that most clearly encompasses this area can be selected.
This resource shows current depravation levels, as well as a comparison with the previous statistical release in 2015. This resource indicates how deprived an LSOA is by stating how it ranks (in terms of number and percentage) compared to the other 32,844 LSOAs in England. For example, a given LSOA is ranked 3,174 out of 32,844 LSOAs in England; where 1 is the most deprived. This is amongst the 10% most deprived neighbourhoods in the country.
Related Products
The Transforming Your High Street Report
Desk Research and Reports for the Unlocking your Place Potential Programme
Reference
More information about the IoD 2019 can be found in the report issued by MHCLG.